
The channel moved.
The measurement did not.
Original research on what content is now cited for, budgeted against and read by - what publishers report, what assistants retrieve, and the distance between them. Eleven features in this edition. How we did it, the data behind it and what it does not prove.
Ranking stopped predicting citation. Content did not stop being read.
Google search traffic to publishers fell by a third in a single year. AI Overviews cite pages that do not rank in the top ten. Budgets went up while the primary distribution channel went down. Every one of those sentences would have been a contradiction two years ago.
Most of what passes for content analysis still runs on session counts and ranking positions, both of which have decoupled from the outcomes they used to stand in for. This desk works from the citation, the budget line and the reader backwards, and states what each measurement can and cannot support.
We publish what we find, including where the evidence does not support a conclusion. Every feature states its method, its evidence base and what it cannot establish.
Content Legendary
The operators who produce this research also run content as a service - editorial systems, thought leadership, research reports and the plumbing beneath them. We report what content is cited for, not what it ranks for, because those stopped being the same measurement.
Features
Edition Q1 2026 · 11 features in this deskA third of the traffic is gone.
Google search traffic to publishers fell 33% globally and 38% in the US in the year to November 2025. The largest single-year change to content distribution since search became the default channel.
Read the feature →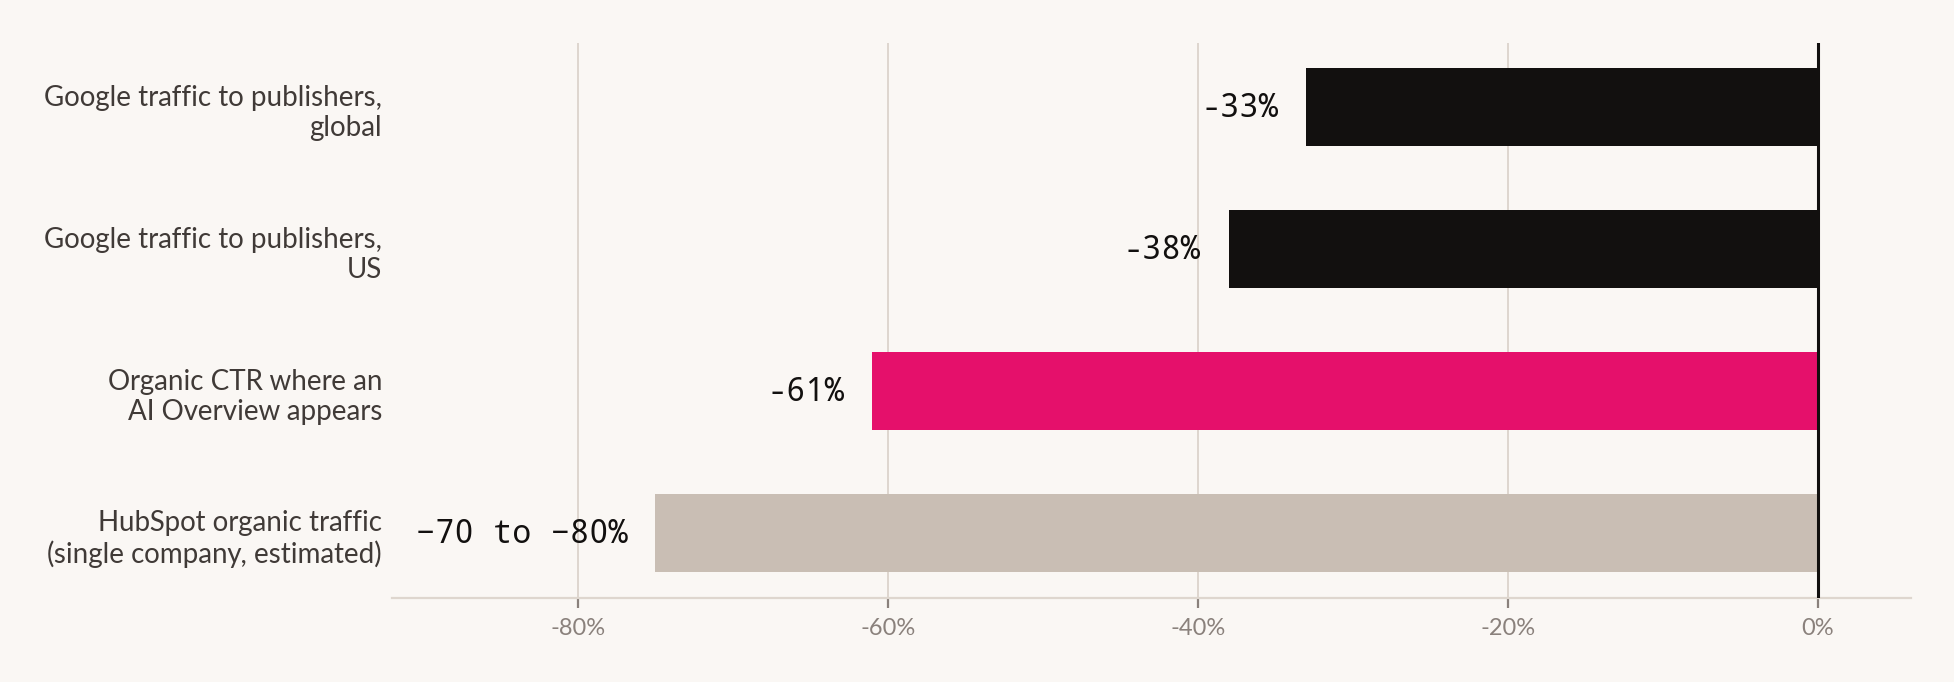
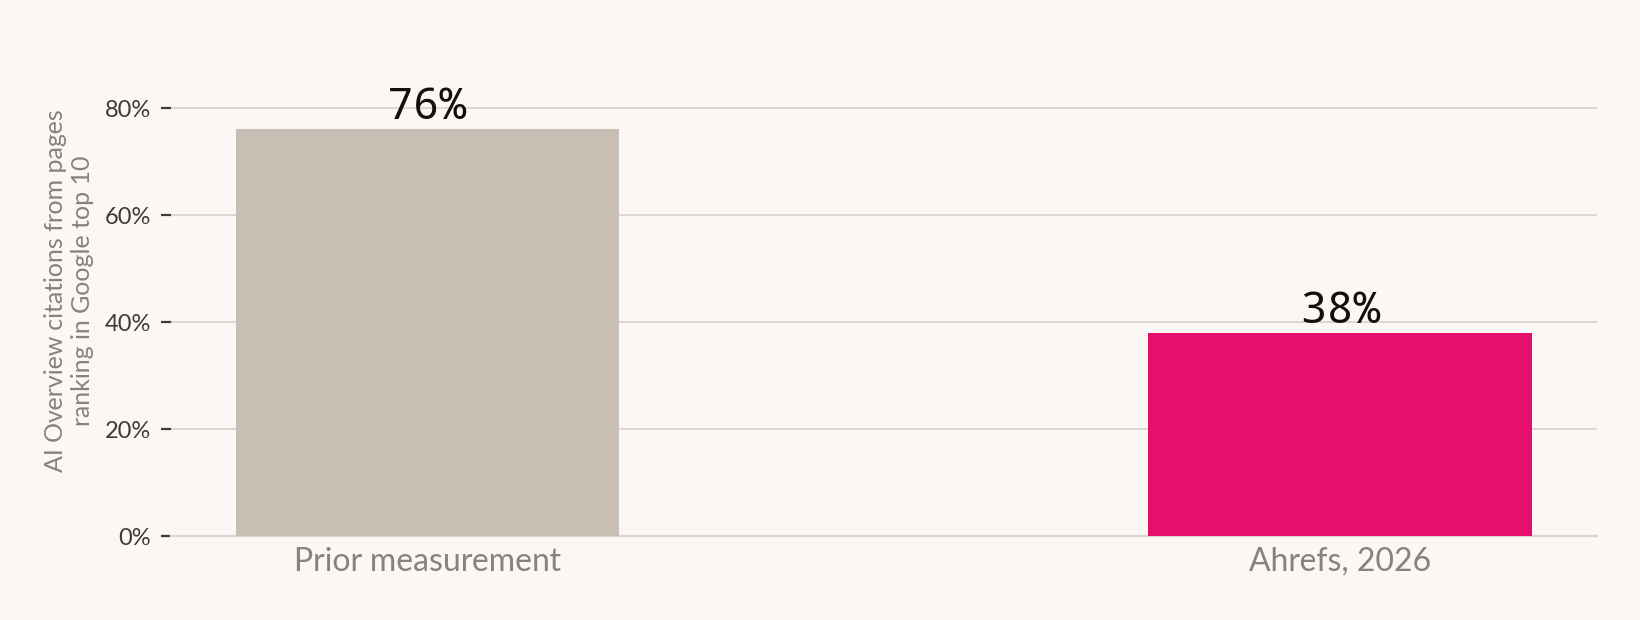
Ranking stopped predicting citation
Only 38% of AI Overview citations come from pages ranking in Google's top ten, down from 76%. Ranking and citation have decoupled, and the discipline's instrumentation has not caught up.
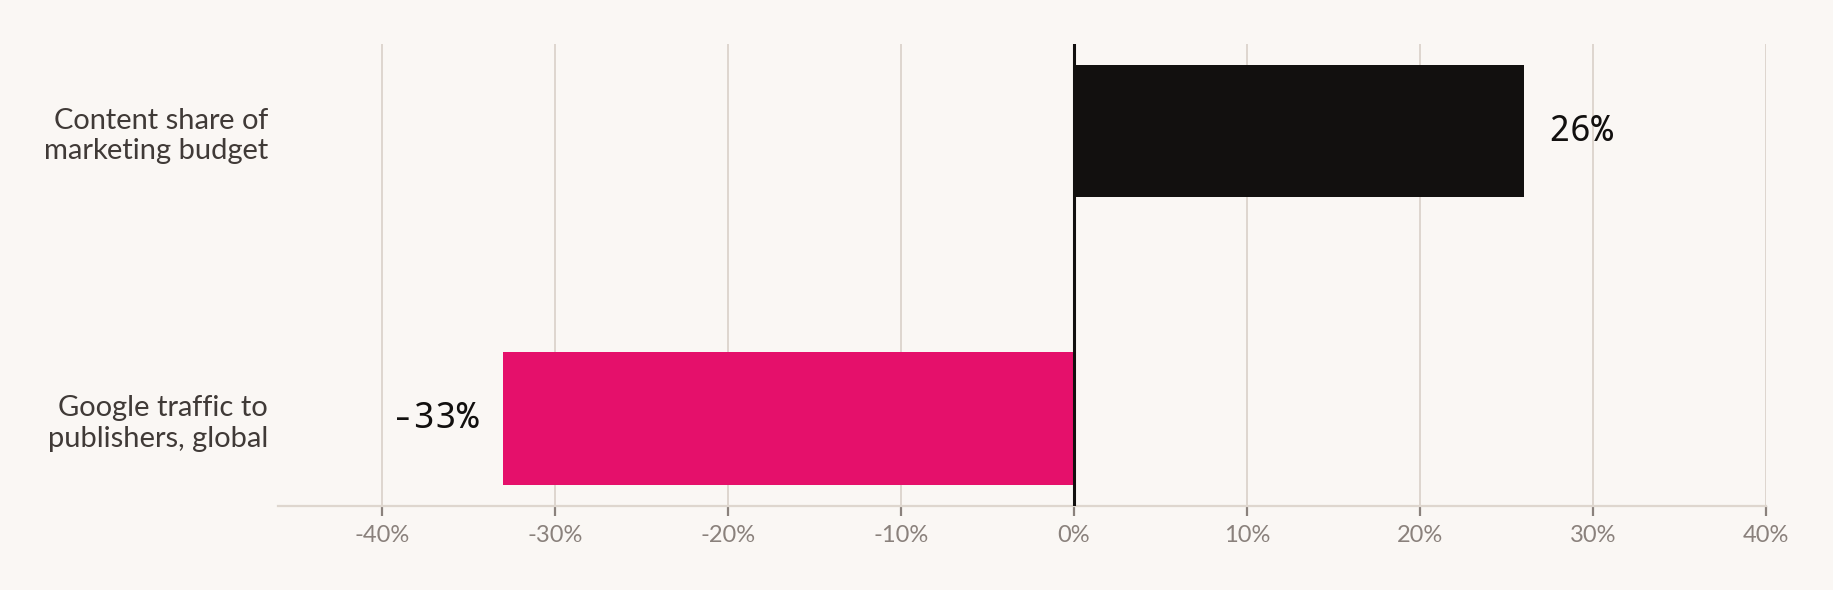
Content budgets rose as content traffic fell
Content takes 26% of marketing budget and 61% of B2B marketers are increasing it, in the year its primary distribution channel fell 33%. Confidence, diversification or inflation look identical in a budget line.
The hedge is real. Its numbers are not.
Email is the standard answer to losing search traffic and the structural case is sound. The figures used to sell it - $36 to $42 per dollar, 760% lifts - have no traceable cost basis.
Everyone cites the same number
Executive content is sold on statistics that cannot be traced to a source.
The session was never the point.
Five features on this desk describe one failure: the metric that governed content for twenty years stopped tracking anything. Sessions were always a proxy for something else.
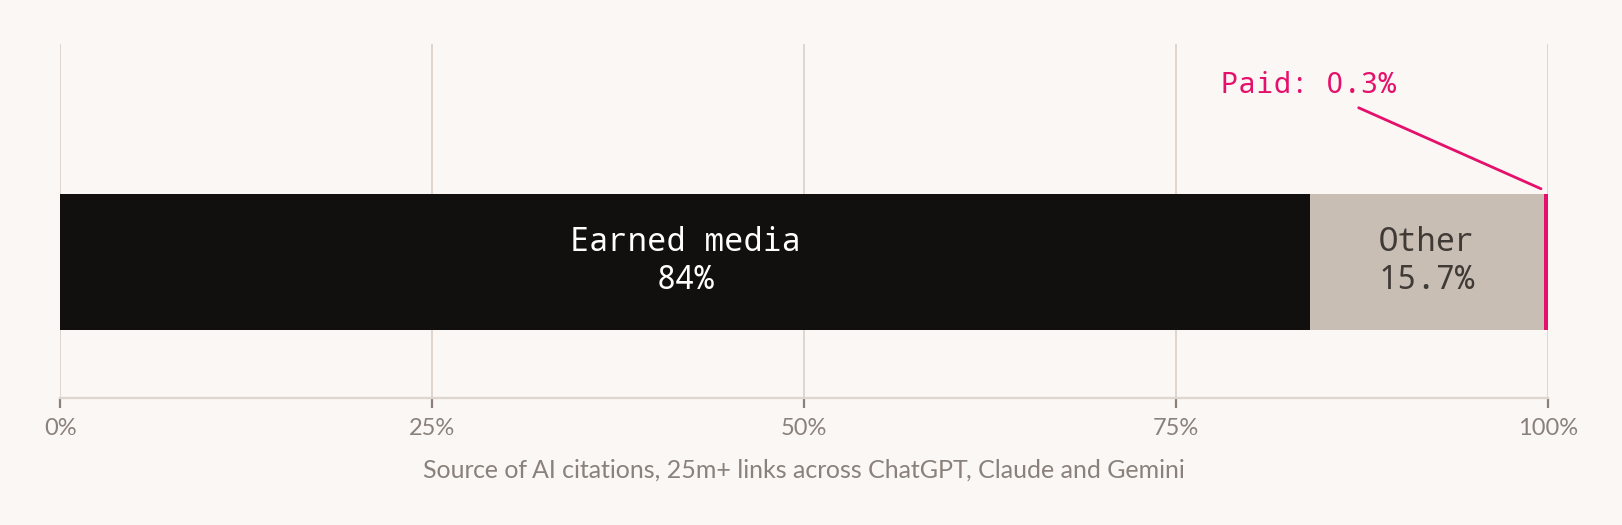
AI cites earned media and almost never paid
An analysis of 25 million-plus links found 84% of AI citations come from earned media and 0.3% from paid. The dominant new channel has no purchasable entrance.
Paid search grew while search shrank
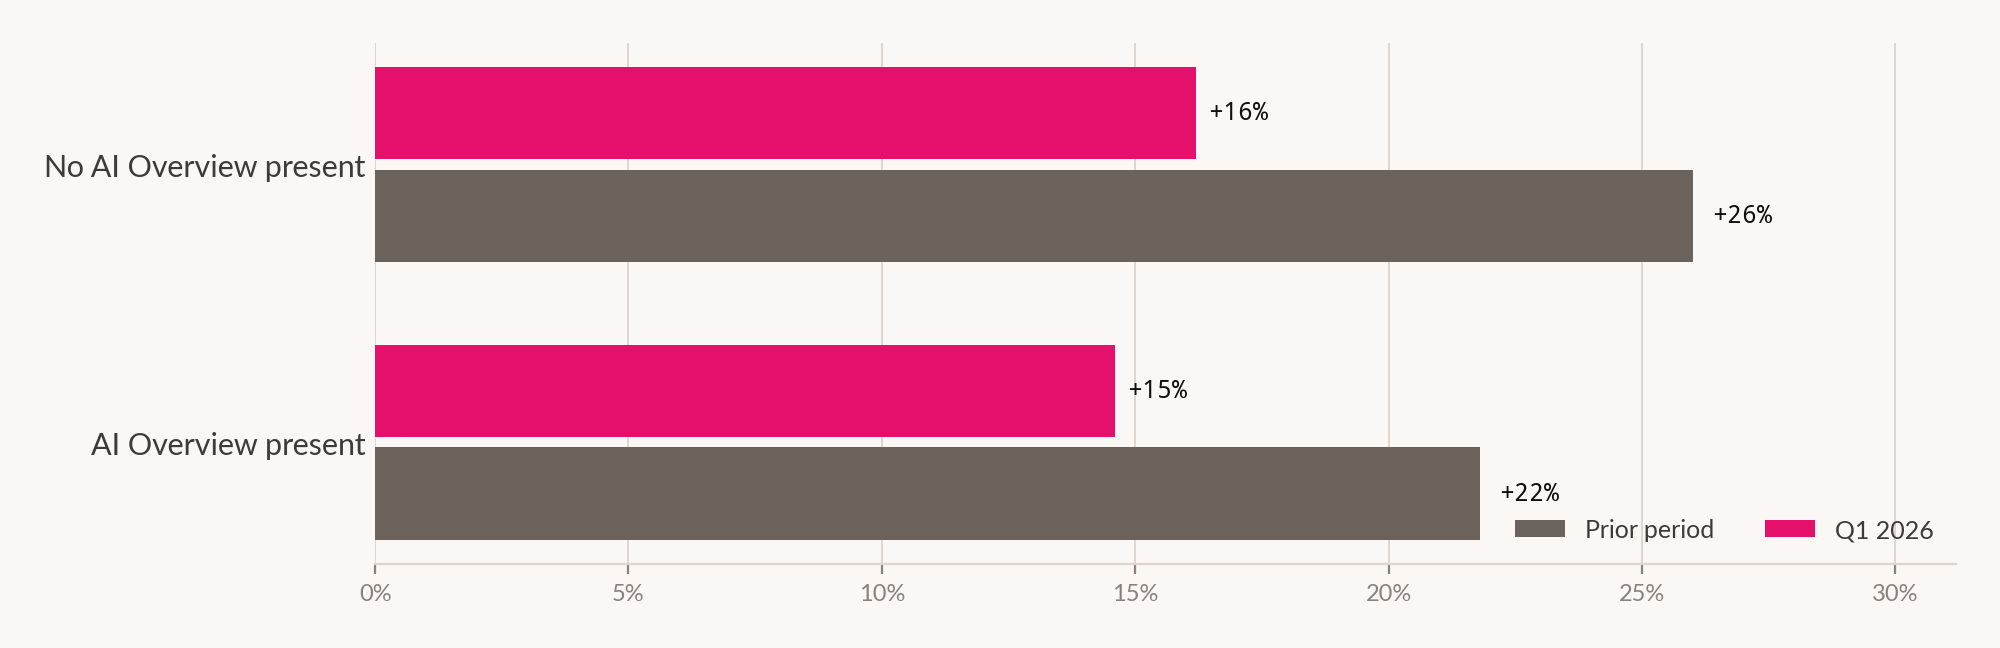
An answer layer sits between the query and the result. Paid search grew anyway.
The martech market stopped growing
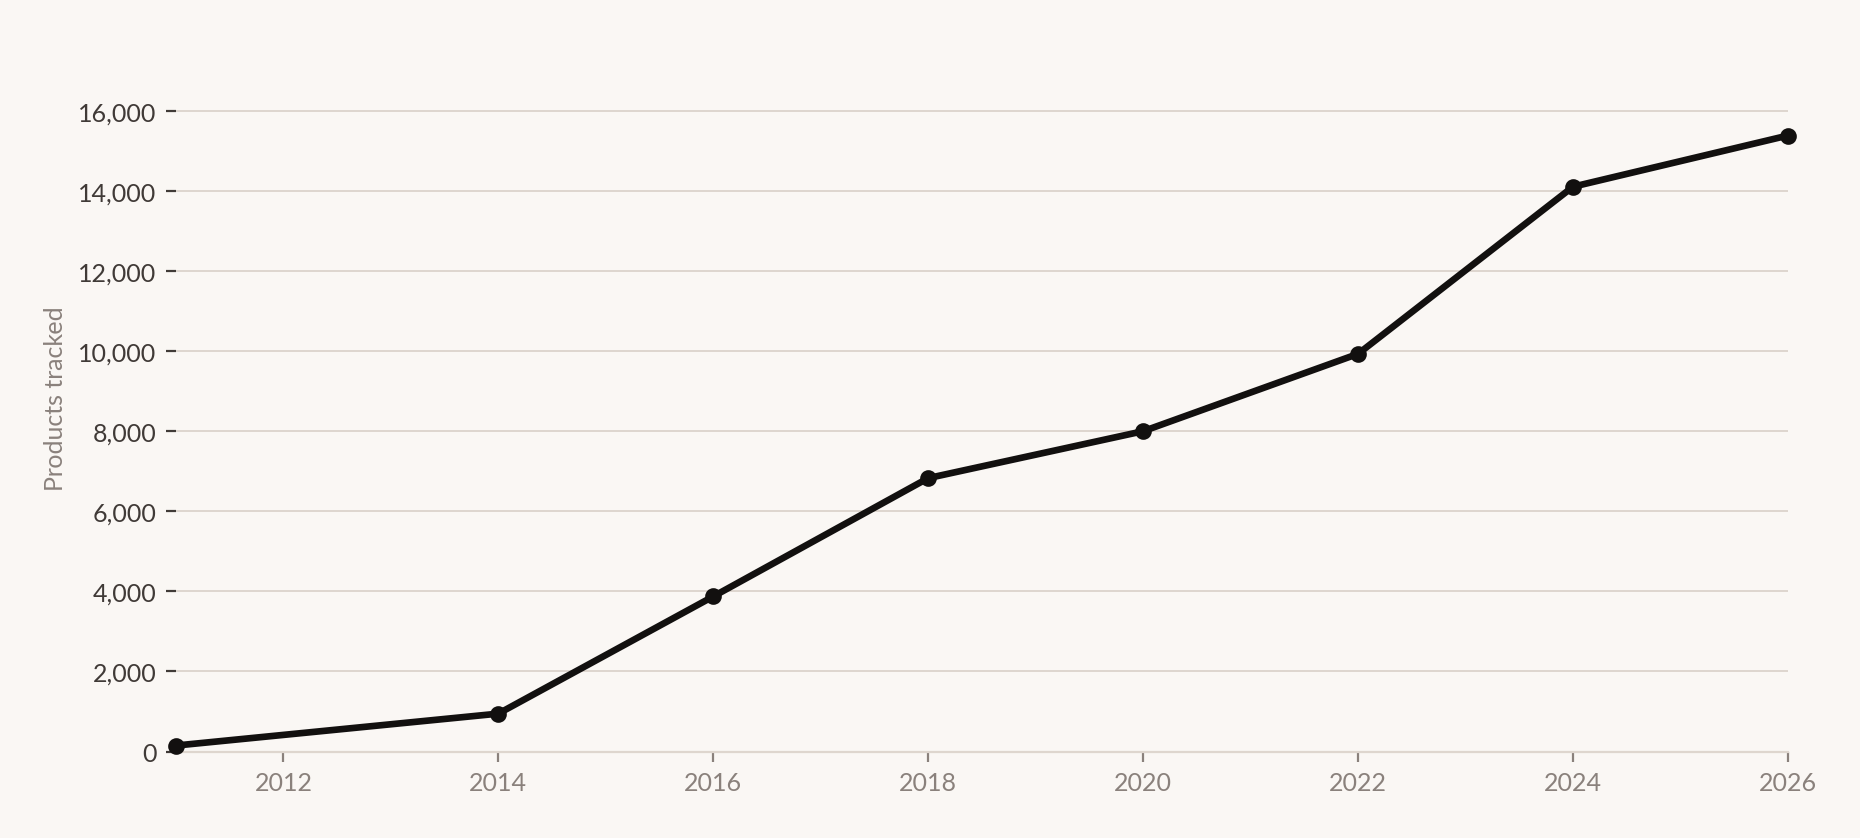
The stack stopped expanding. What replaced expansion is more interesting.
Production got cheap. Reviewing it did not.
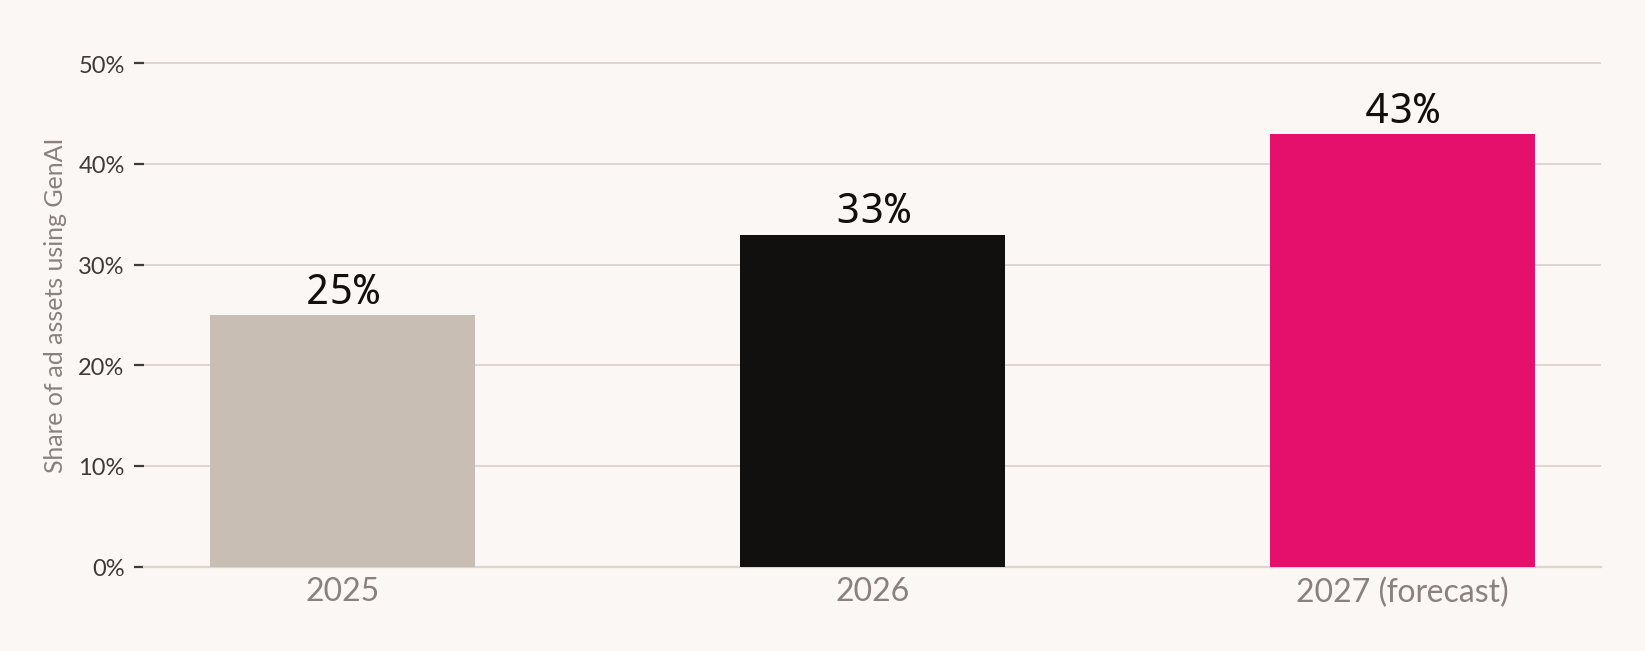
Generative tooling takes a third of ad assets in 2026. Production was never the binding constraint on creative. Reading the results was, and that ceiling has not moved.
Designers cannot agree whether design got better
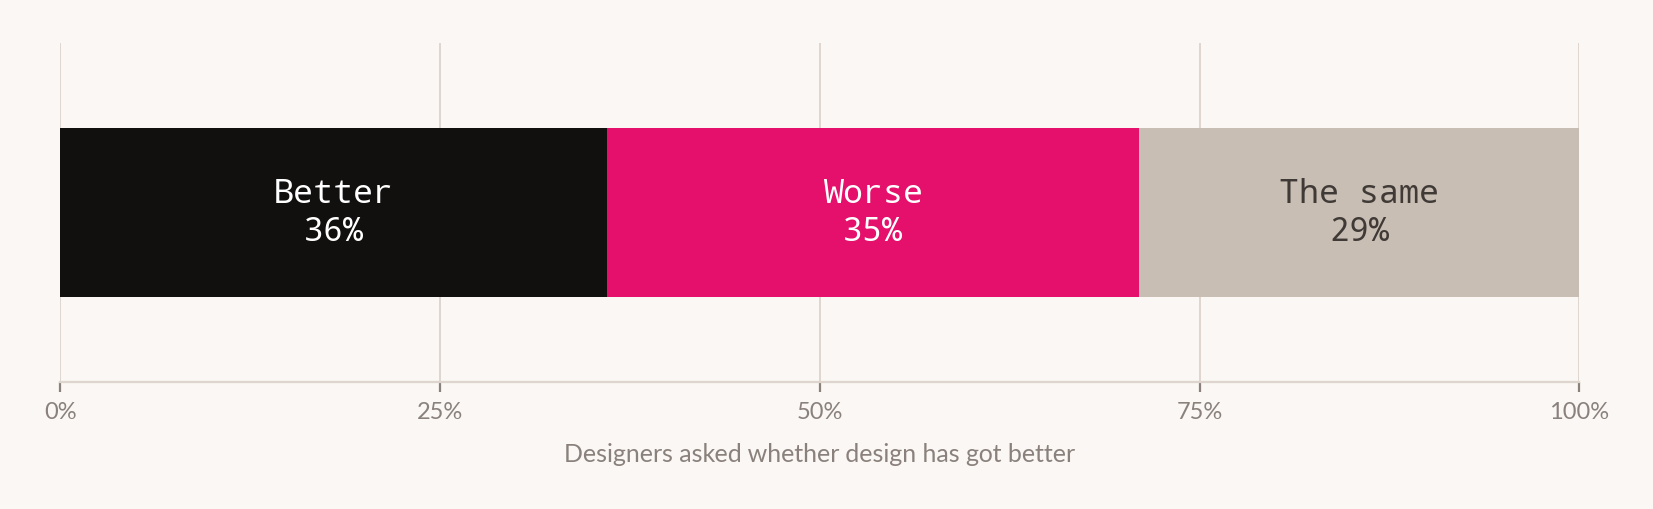
Asked whether design has improved, designers split 36% better, 35% worse, 29% the same. A profession that cannot agree on the direction of its own output has no shared quality standard.
One issue a quarter.
Nothing in between.
Every edition collects the quarter's features and reports across all seven desks into a single issue. No weekly send, no roundups.