
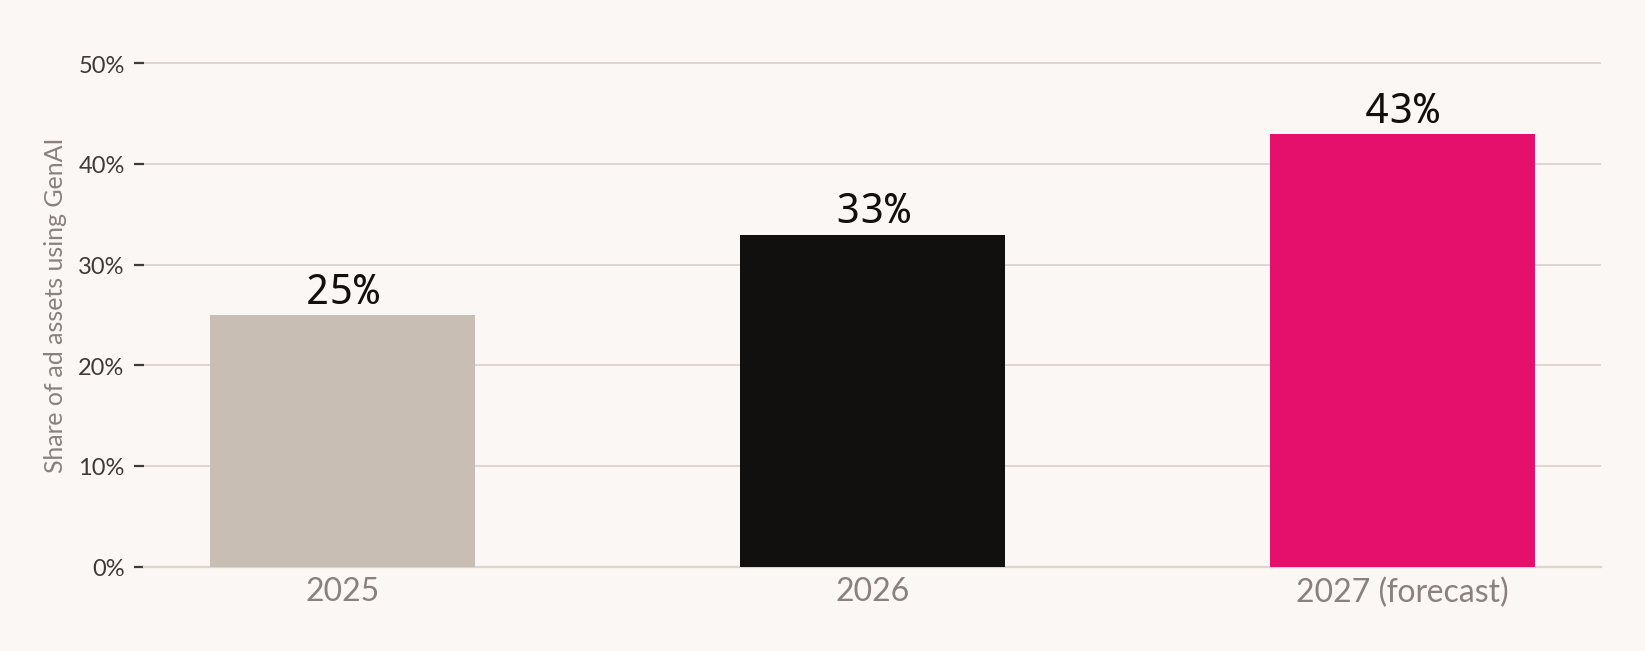
The adoption figure is not in dispute. Generative AI accounts for roughly one-third of ad assets in 2026, up from one-quarter in 2025, and is forecast to reach 43% by 2027.1 Nearly two-thirds of video ad buyers now use it.1
Around this curve sits a set of economic claims that arrive with striking confidence: $2.65 per asset. Seventeen to twenty-six minutes per finished asset. An 80% reduction in production cost. A tenfold increase in output. A 400% increase in content volume.2
We tried to source them.
The adoption curve is evidence. The cost multipliers are advertising for the thing they describe.
Production was not the constraint
Grant the vendors their numbers for a moment. Assume production really is ten times faster and eighty per cent cheaper. The question that follows is the one nobody in that sales conversation asks: was production the thing stopping you?
For a small number of organisations, yes. For most, the binding constraints on creative were somewhere else entirely - in approval cycles, in legal and brand review, in the number of stakeholders who must see a thing before it ships, and in whether there is enough traffic to learn anything from what did ship.
Relieving a constraint that was not binding does not increase throughput. It moves the queue.
The arithmetic of reading a test
The last item in the right-hand column is the one that can be calculated rather than argued, so let us calculate it.
To detect a 10% relative improvement on a 2% baseline conversion rate, at 95% confidence and 80% power, a standard sample-size approximation gives roughly 78,400 impressions per variant.
Now fix the media budget. Take a campaign delivering one million impressions in a quarter - a realistic figure for a mid-sized programme. Divide it.
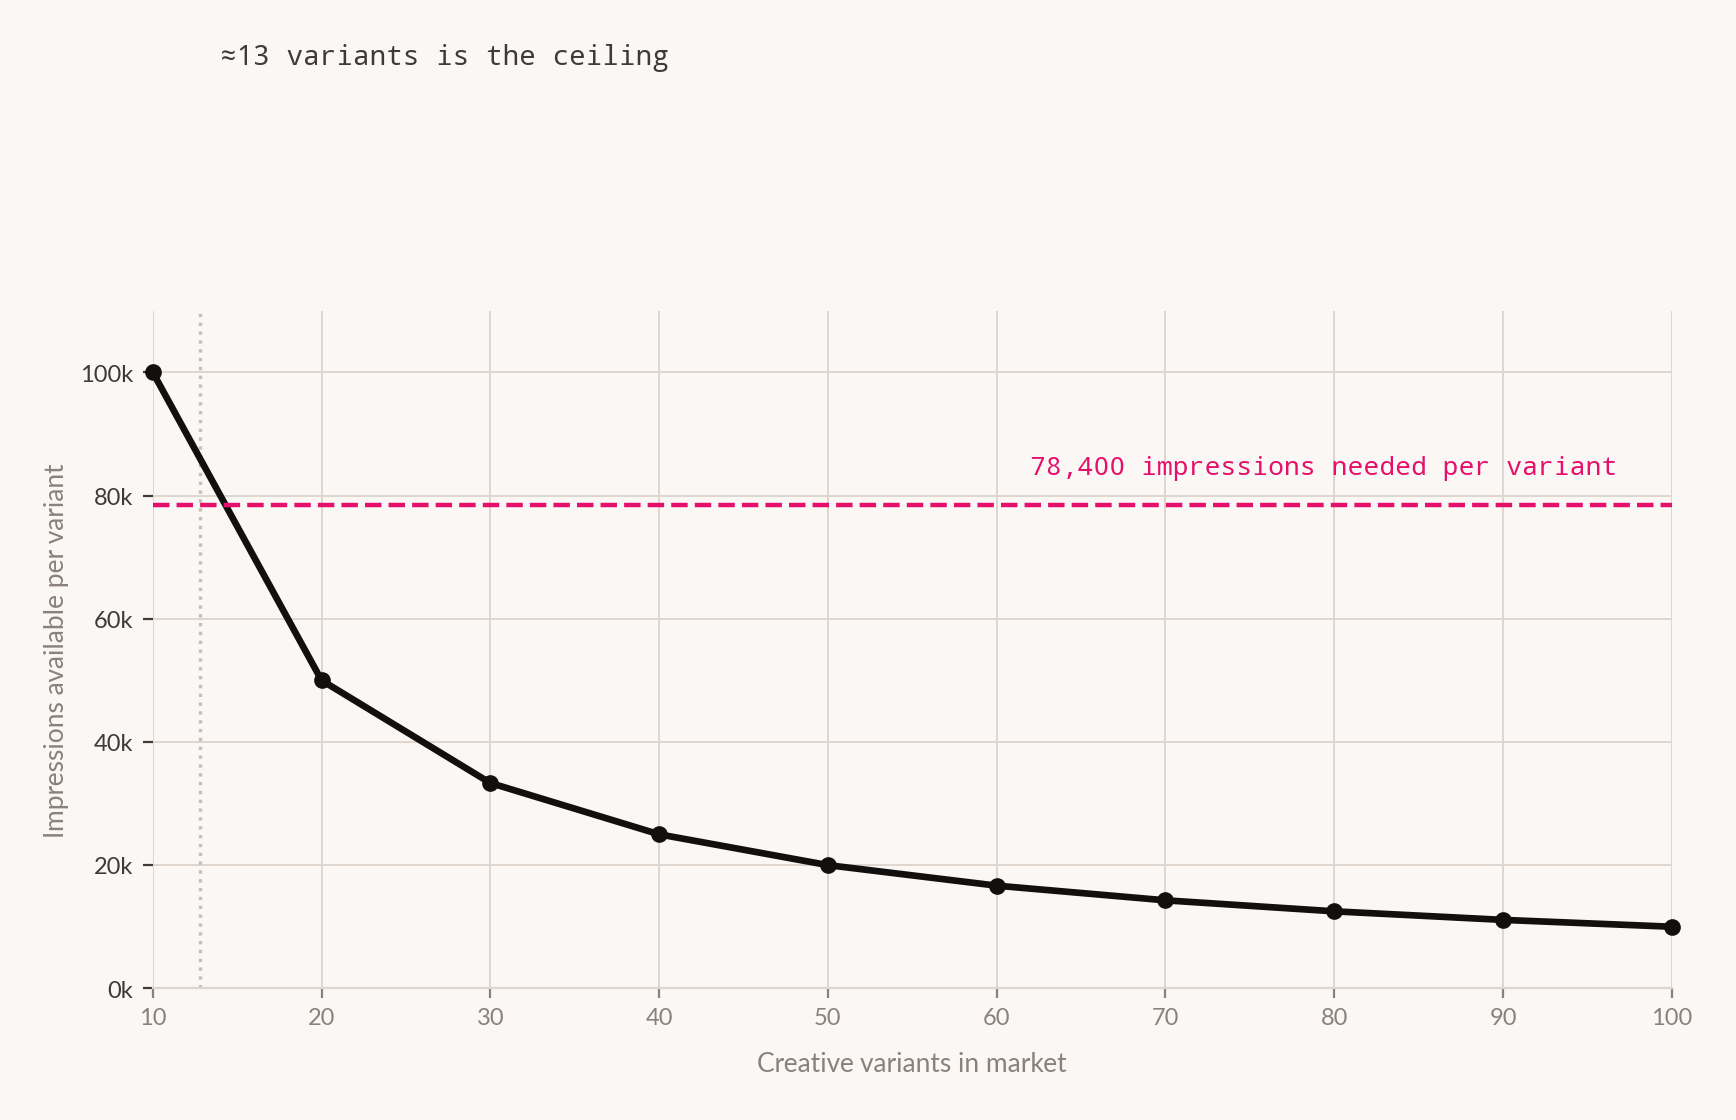
At one million impressions, the number of variants you can evaluate to that standard is approximately thirteen.
Not thirteen that you can make. Thirteen that you can read. The hundredth variant is not a hundredth of a learning - it is a rounding error with a filename.
This is not an argument for making thirteen assets - volume has real uses, set out below.
It is an argument against the sentence that follows most volume claims - that more assets means more learning. More assets on the same budget means less learning per asset, and past a threshold you can calculate, none.
The steelman for volume
There is a serious argument for producing far more than thirteen, and it does not depend on any vendor claim. It deserves stating properly rather than being waved at.
Feature 02 of this edition documents the shift to automated buying: Google's automated shopping product now takes two-thirds of Shopping budgets. These systems are not campaigns in the old sense. They are allocation engines, and they consume creative as raw material. Supply them four assets and they have almost nothing to allocate between; supply them sixty and they have a combinatorial space to search. The system's own optimisation is doing a kind of selection that no human test protocol replicates.
Three other uses are equally legitimate and equally indifferent to statistical significance:
- Coverage. Placements, aspect ratios and formats multiply. One concept correctly built for every slot is not thirteen experiments; it is one experiment, correctly delivered.
- Localisation. Markets, languages and cultural variants. A version for Tamil-speaking users is not competing with the Hindi version for a learning; both are serving different people.
- Fatigue. Refresh slows decay in performance over a flight. Rotation is a maintenance activity, not a test.
Each of these is a real reason to make a hundred assets, and generative tooling serves all of them well. What none of them produces is a finding.
Volume for coverage, localisation, fatigue and machine allocation is sound practice. Volume described as learning is the error, and it is usually the same volume.
The failure is not overproduction. It is the report at the end of the quarter that lists ninety-four assets and presents the best-performing three as insight, when the difference between them sits well inside the noise their impression counts can support.
What the market is paying for this
Money is arriving well ahead of the evidence. Generative AI in the creative industries is put at $4.06bn in 2025, rising to $5.38bn in 2026 - a compound growth rate of 32.3% - and forecast to reach $14.03bn by 2030.3
Set that against what Figure 02 established. The category is compounding above thirty per cent a year on an evidence base in which the central economic claims - cost per asset, time per asset, output multiple - could not be traced to a single study with a stated method.
That gap is not evidence of a bubble, and we are not claiming one. Plenty of technologies are adopted for reasons that are obvious to practitioners long before anyone publishes a controlled study. But it does mean the spending decision is currently being made on vendor arithmetic, and a buyer at these growth rates should expect to generate their own numbers rather than wait for the category to produce them.
The pricing model manufactures the volume
One published price ladder is worth looking at directly, because it reveals the commercial logic: $3.90 per ad on a $39 monthly plan producing ten videos; $1.98 per ad on a $99 plan producing fifty.2
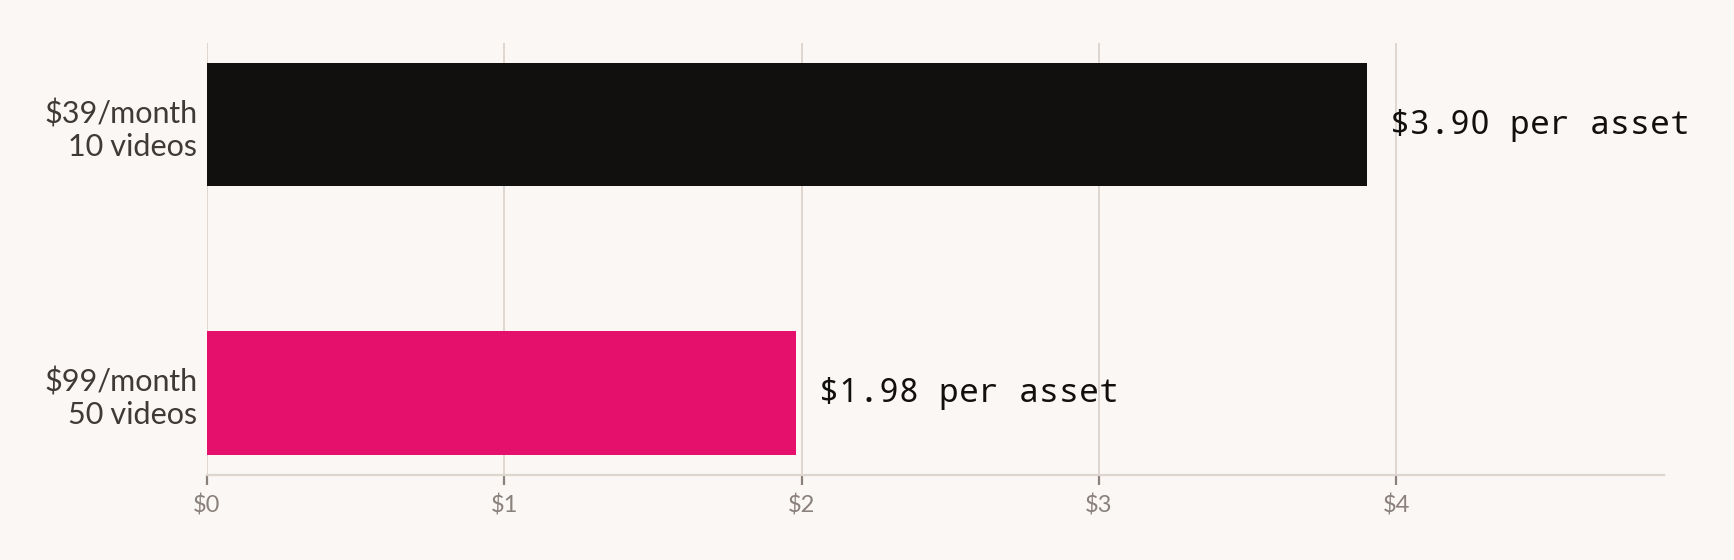
The cheaper per-unit price is real. It is also conditional on producing five times as much. A buyer optimising the headline number is committing to volume before establishing that volume helps - and the total bill went up, from $39 to $99, while the number that improved was the one nobody is billed on.
This is the same structure Feature 01 of this edition identifies in media buying: a falling unit cost inside a rising total is not efficiency, it is a mix change. The unit got cheaper because you bought more of a cheaper thing.
Two costs that scale with volume
Two exposures grow with asset count and neither is priced into the per-asset figure.
Brand consistency. Every generated variant is a chance to drift - a wrong tint, an off-scale logo, type that is nearly but not quite the brand face. At ten assets a human catches it. At a hundred, the review that catches it costs more than the assets did, and the review that does not catch it ships the drift into market.
Accessibility exposure. Feature 15 of this edition sets out the position: the European Accessibility Act has been enforceable since 28 June 2025, first legal notices arrived nine days later, and breaches are observable from outside the organisation. Every additional public asset is an additional observable artefact. Automated layout optimises for visual density and brand impression, not for contrast thresholds or meaningful alternative text.
Both costs land in review - the stage the tooling does not touch.
Whose interest this serves
The cost and output claims audited here are published by companies selling generative production tooling. Every one of them supports buying the product. Our own position is not neutral either: Marketing Legendary operates a creative practice, and an argument that volume without evaluation is wasteful is an argument for the kind of work we sell. The arithmetic in Figure 04 is offered precisely because it can be checked independently of either interest - the formula and the parameters are printed, and a reader who disagrees with our assumptions can substitute their own and reach their own ceiling.
What to do about it
Calculate your own ceiling before you scale output. Take your actual quarterly impressions, your actual baseline conversion rate and the smallest lift worth acting on. The formula is in the Method box. The answer tells you how many variants you can learn from - and everything beyond it is production for coverage, not for evidence.
Separate the two kinds of volume in your plan. Assets made to be tested and assets made to fill placements are different products with different success conditions. Conflating them is what produces a hundred variants and no findings.
Price the review, not the asset. If generation costs $2.65 and review costs a brand manager an hour, your unit economics are set by the second number. A tenfold increase in the cheap input against a fixed expensive one does not reduce cost per shipped asset by anything like the headline.
Move brand and accessibility rules into the component, not the checklist. Constraints enforced in the template hold at any volume. Constraints enforced by a reviewer hold until the reviewer is overwhelmed, which now happens sooner.
Do not accept a cost claim without a baseline. "80% cheaper" than what, measured over what period, including which stages. If the answer is unavailable, the number is marketing.
| Measure | Value | Grade |
|---|---|---|
| Adoption | ||
| GenAI share of ad assets, 2025 | ~25% | Reported |
| GenAI share of ad assets, 2026 | ~33% | Reported |
| GenAI share of ad assets, 2027 | 43% | Forecast |
| Video ad buyers using GenAI | ~2 in 3 | Reported |
| Vendor economics | ||
| Cost per asset | $2.65 | Unverified |
| Time per finished asset | 17–26 min | Unverified |
| Production cost reduction | 80% | No baseline |
| Output increase | 10× | No baseline |
| Published price, $39 plan | $3.90/ad | List price |
| Published price, $99 plan | $1.98/ad | List price |
| The evaluation ceiling - our arithmetic | ||
| Impressions needed per variant | 78,400 | Derived |
| Variants readable at 1M impressions | ~13 | Derived |
| Variants readable at 5M impressions | ~64 | Derived |
| Learning per asset beyond the ceiling | - | Not measurable |
How we did this
n = 16·p(1−p)/δ², a standard normal approximation for two-proportion comparison at 95% confidence and 80% power. With p = 0.02 and δ = 0.002 (a 10% relative lift), n ≈ 78,400 per variant. Dividing an illustrative 1,000,000 impressions gives a ceiling of ≈12.8, which we state as thirteen.What this doesn't prove
- That the cost claims are false. We established that we could not source them. Several may be accurate.
- That generative production is a bad decision. The adoption curve is real and the coverage and localisation use cases do not require statistical evaluation. This is an argument about what volume can and cannot teach you.
- That thirteen is your number. It follows from three assumptions we printed. A higher baseline conversion rate, a larger detectable effect or a bigger budget all raise it, in some cases sharply.
- That sequential or bandit testing behaves this way. The calculation assumes a fixed-horizon comparison. Adaptive allocation methods reach conclusions differently and we have not modelled them.
- That generated creative underperforms. Nothing here compares the effectiveness of generated and hand-made work. Feature 13 of this edition addresses creative effectiveness and finds no data on that comparison either.
- That the market sizing figures are reliable. They are commercial research summaries whose methodology we have not seen, and we report them as a growth signal rather than as precise measurement.
- That automated buying systems perform better with more assets. The mechanism is plausible and the platforms assert it. We found no independent test of the relationship between asset count and outcome.
- Any figure for review capacity or its cost. The claim that review is the binding constraint is reasoning about process, not a measurement. No study we found decomposes creative cycle time by stage.
Sources for this feature
- Generative AI adoption in advertising production, industry forecasting coverage, 2026. novoads.ai, socialmediaexaminer.com A named study, reported by someone else - trade coverage
- Vendor cost, output and subscription pricing claims, 2026 - audited in Figure 02 as subject, not authority. adstellar.ai, aiadvantageagency.com, sovran.ai From a company that sells into this market - vendor
- Generative AI in creative industries market sizing, 2026. thebusinessresearchcompany.com From a company that sells into this market - commercial research summary
- Features 01, 02, 12, 13 and 15 of this edition. Another feature in this edition