
The store stopped
being a shop.
Original research on mobile apps - the age-signal statutes on the calendar, the volume-versus-price split that reordered the market, the AI cohort's retention paradox, the growth distribution that defies a median, and the commission regimes that diverged from 0% to 26%. Eleven features in this edition. How we did it, the data behind it and what it does not prove.
The commission was the argument. The dependencies were the change.
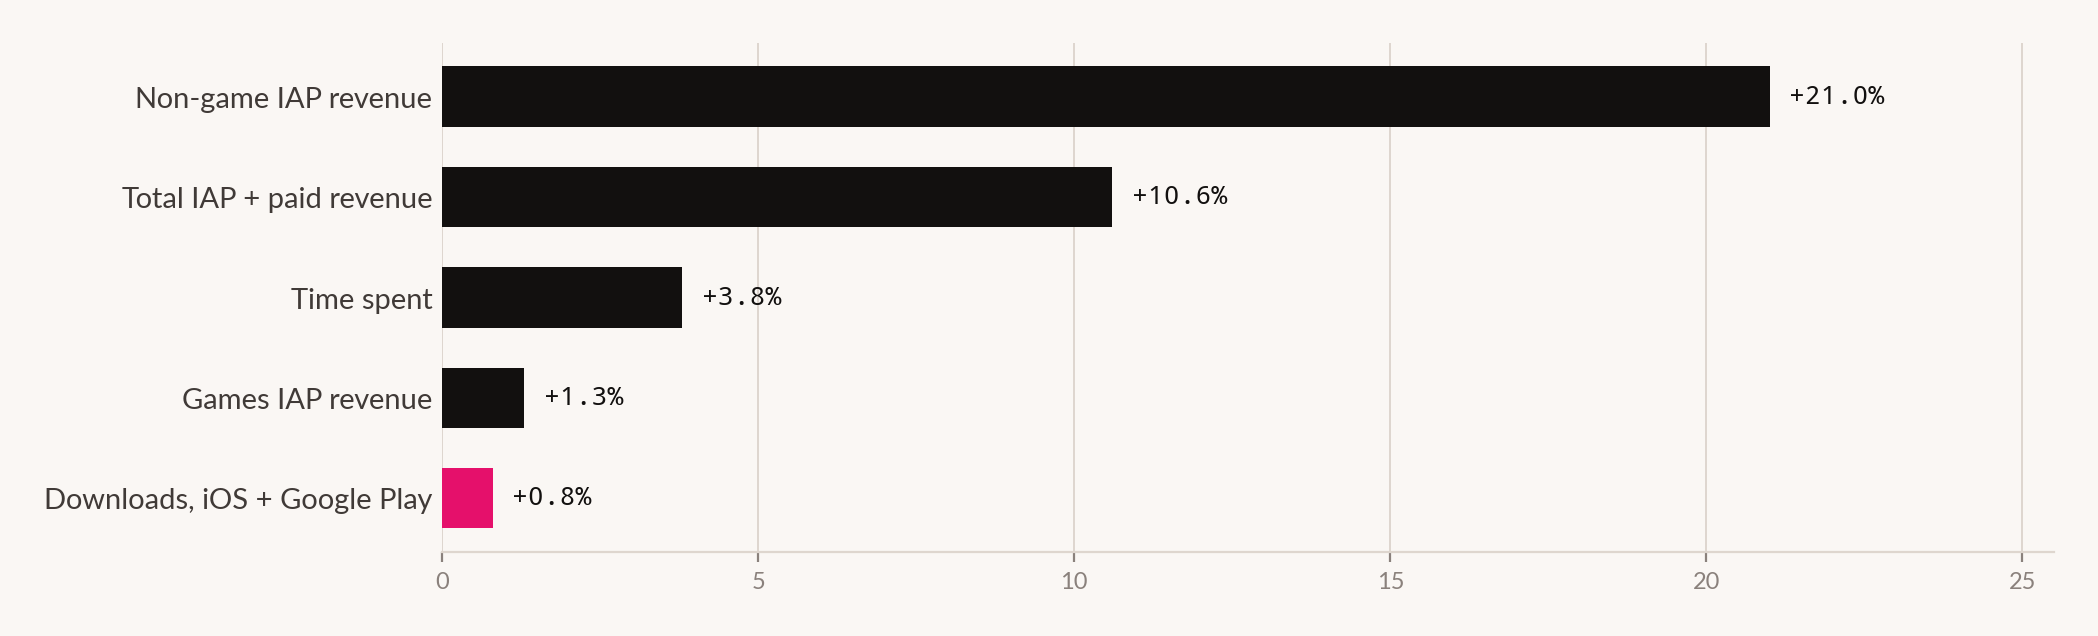
Global app downloads grew 0.8% in 2025 while consumer spend grew 10.6%. Non-game revenue quietly passed games. The market went from a volume story to a price story, and the operating decisions after that point changed accordingly.
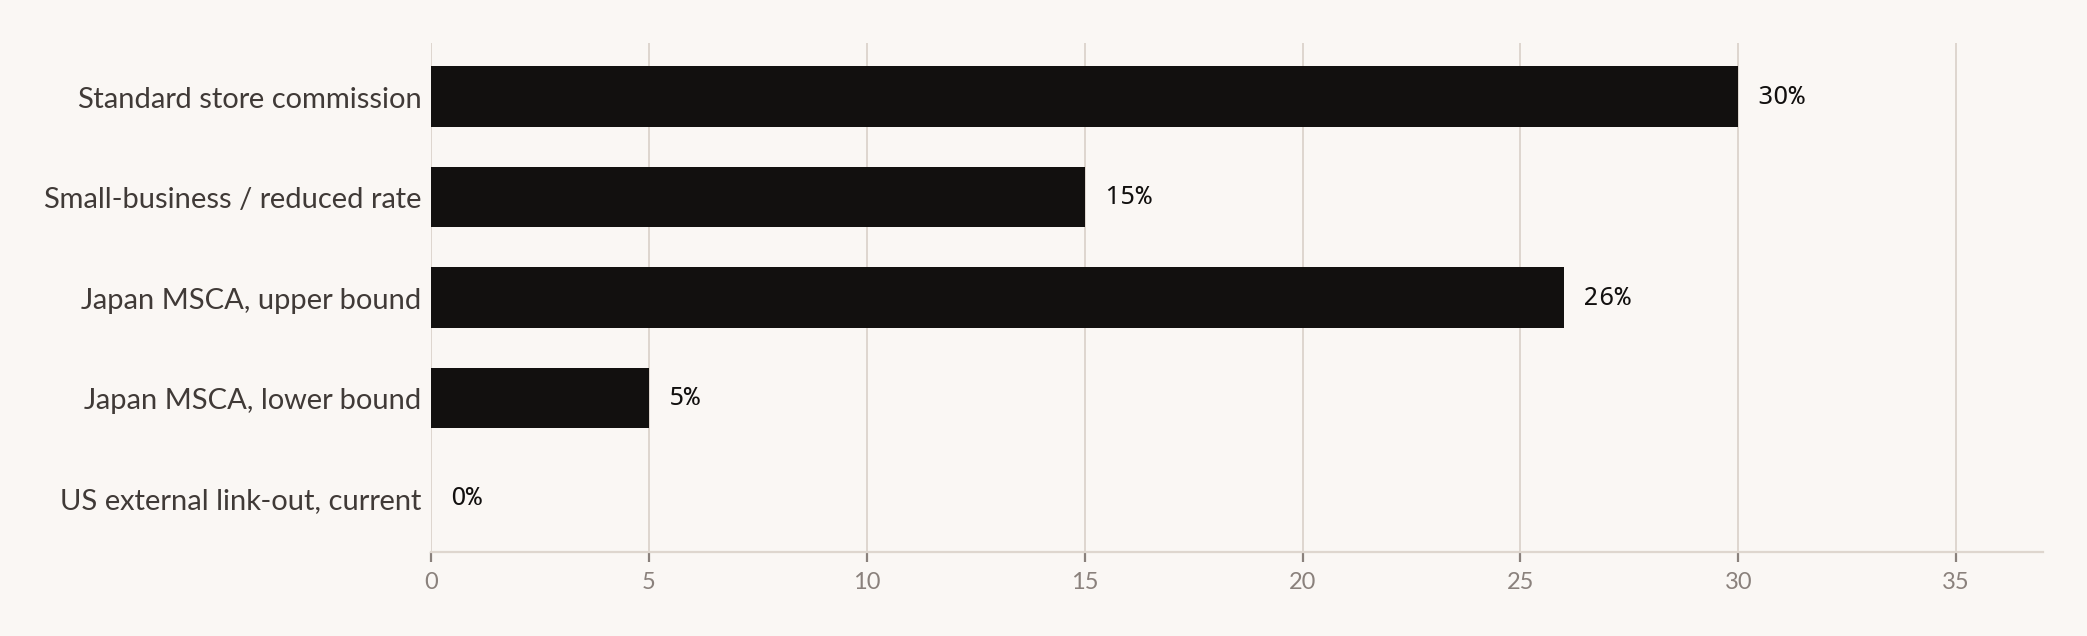
Four US states passed App Store Accountability Acts. Only Texas is in force. Utah and Louisiana were delayed to 2027 by amendment; Louisiana reversed its developer safe harbour. The EU DMA, the US Epic ruling and Korean legislation moved commissions from one number to a range: 0% (US external link-out) to 26% (EU baseline). What each regime actually charges is the feature, not the headline.
We publish what we find, including where sources disagree and where units do not match. Every feature states its method, its evidence base and what it cannot establish.
App Legendary
All things mobile apps - discovery, acquisition and store performance. We start with the volume-versus-price question, because it determines every decision after it.
Features
Edition Q1 2026 · 11 features in this deskFour states passed the same law. One is live.
Four US states passed App Store Accountability Acts. Only Texas is in force. Utah and Louisiana were delayed to 2027 by amendment and Louisiana reversed its developer safe harbour. What the age-signal laws actually require.
Read the feature →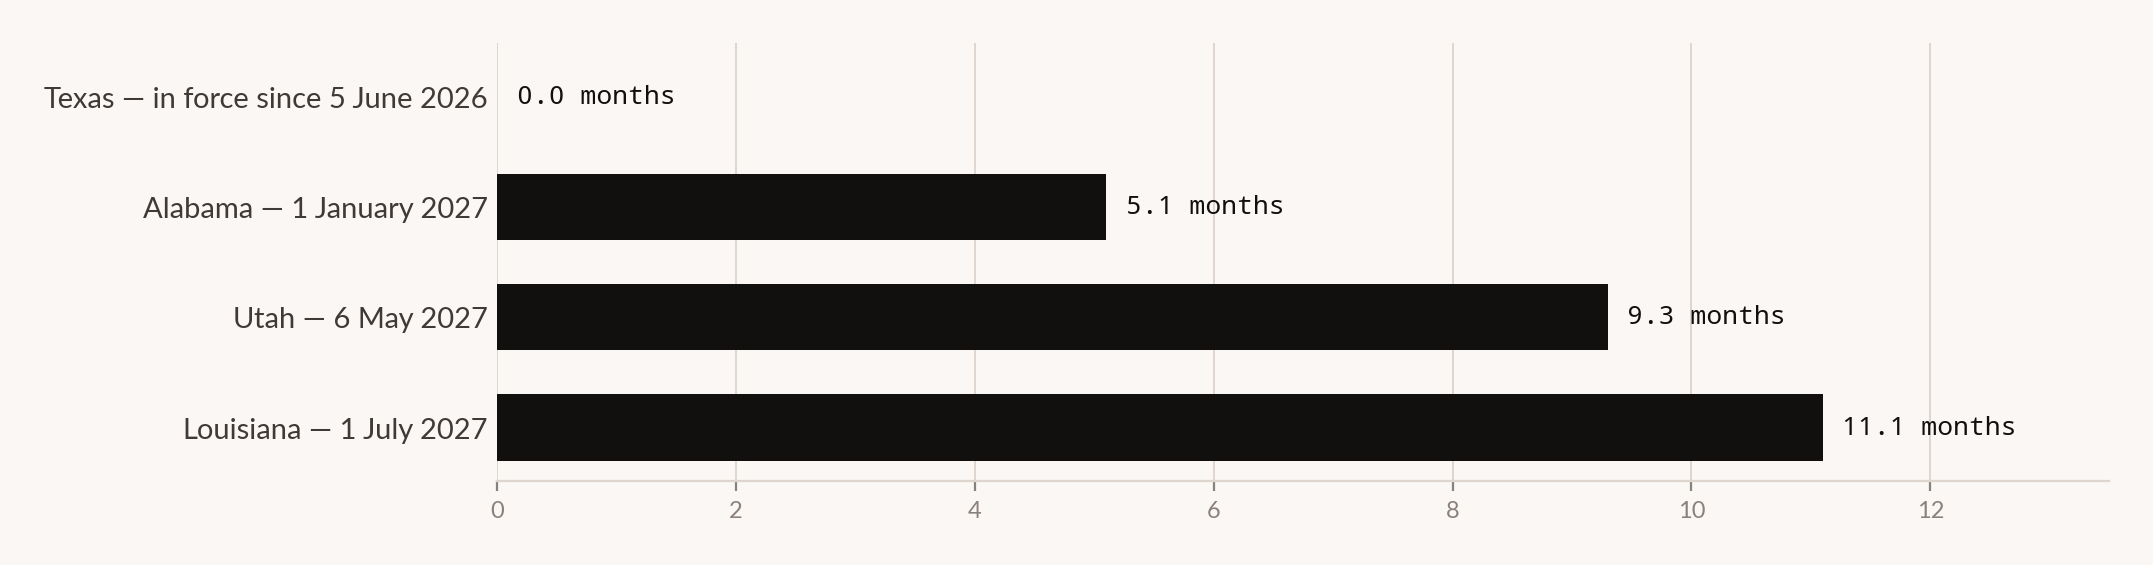
App installs stopped growing. Spending did not.
Global app downloads grew 0.8% in 2025 while consumer spend grew 10.6%. Non-game revenue quietly passed games. The volume-versus-price question that determines every decision after it.
AI apps earn more and keep users less
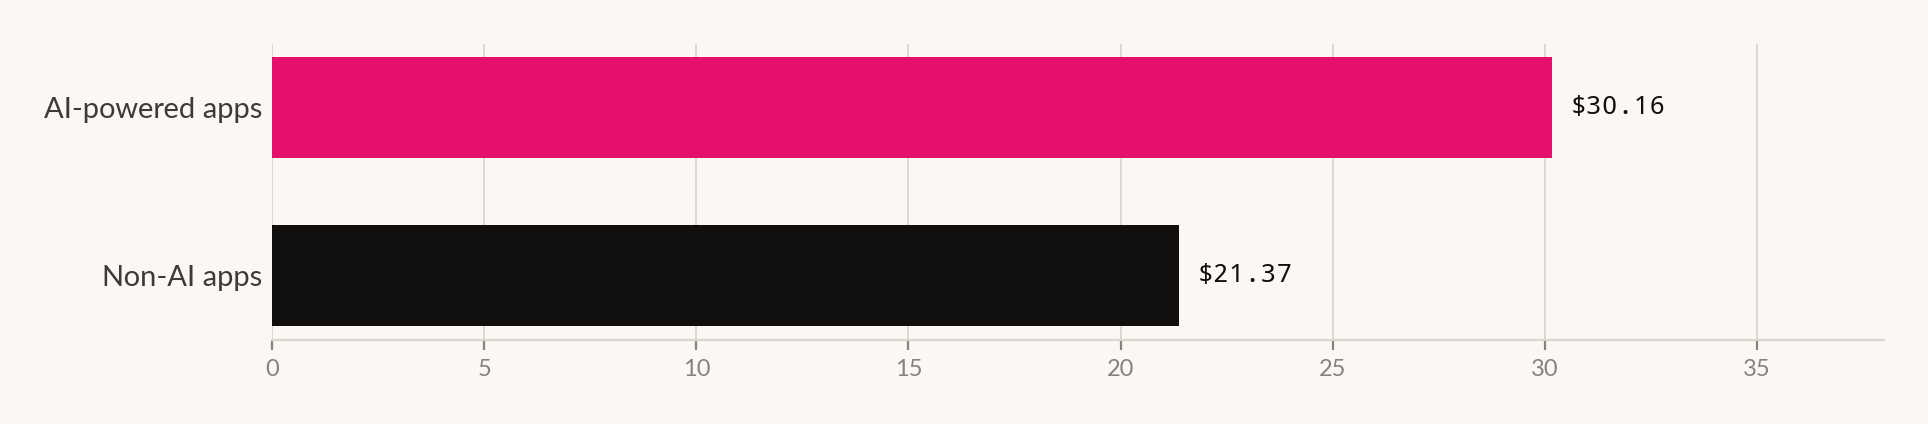
AI-adjacent apps command a 41% LTV premium. Retention is 31% worse on annual plans and 36% worse on monthly. Two gaps that do not average - and should not.
The middle of the app market disappeared
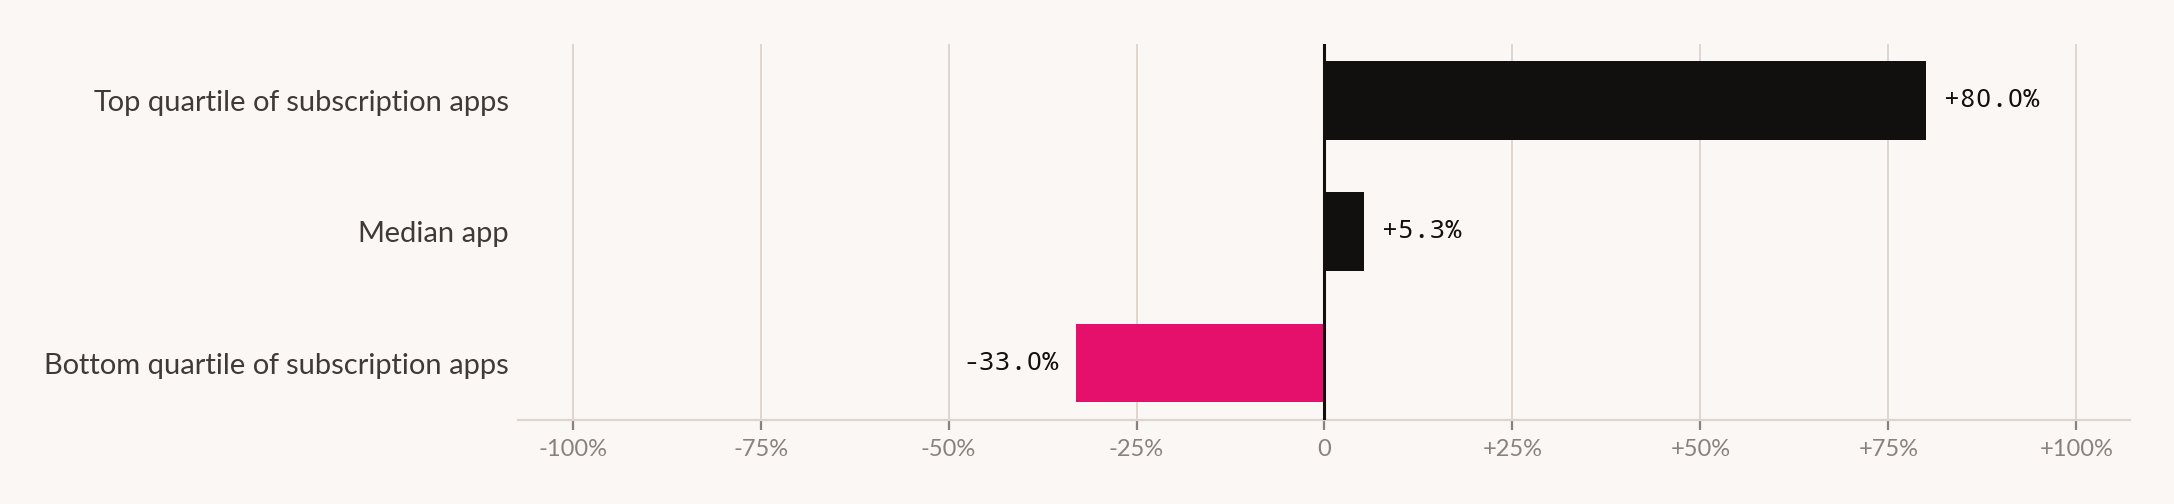
The top 5% of subscription apps grew 80% year on year while the bottom quartile fell 33%. The distribution is the finding. Median growth is a 5-17% band, not a point.
The app store fight moved almost no money
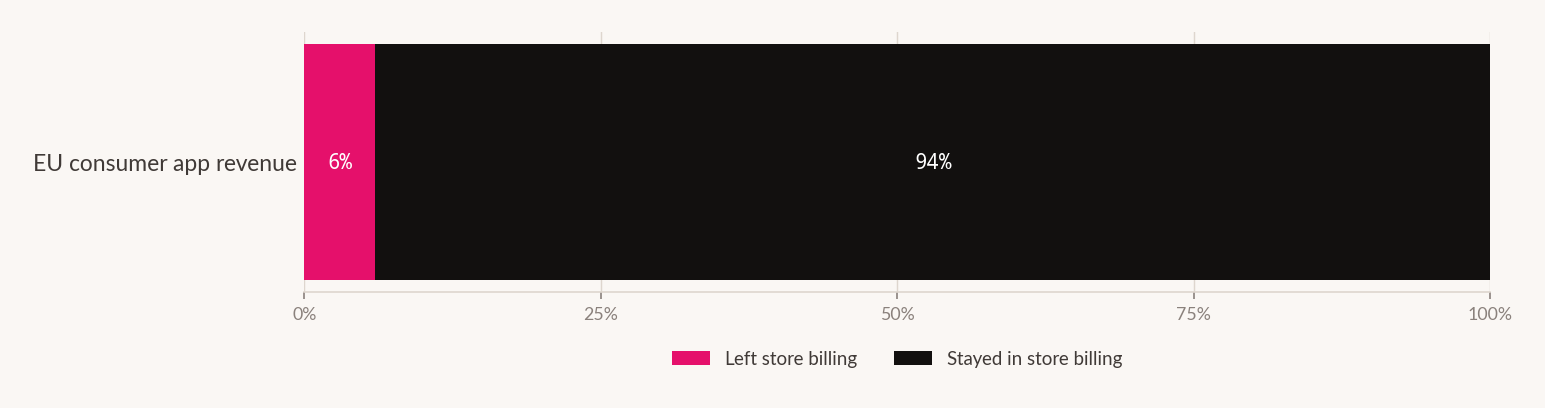
Two landmark rulings broke the app stores open. 3–6% of revenue moved.
Three regulators, three different answers on commission
Commission regimes diverged in 2025-2026. The EU DMA, the US Epic ruling and Korean legislation created a range from 0% (US external link-out) to 26% (EU baseline). What each regime actually charges.
The store stopped being a shop.
Five features on this desk describe five unrelated events. Each one takes something the developer used to hold - the identity signal, the install pool, the capability, the billing, the price - and moves it somewhere else. The commission was the argument. The dependencies were the change.
Australia closed 4.7m teen accounts. Most teens still got in.
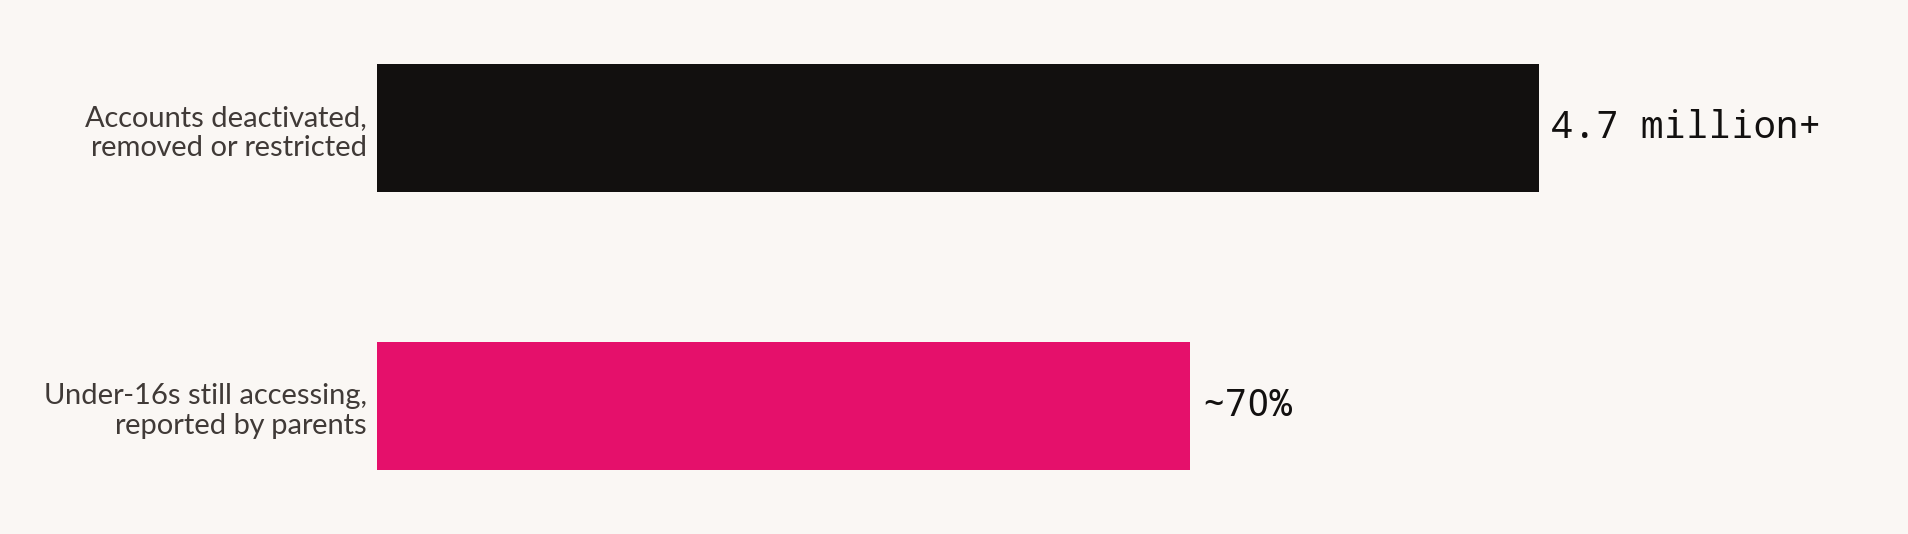
Australia removed 4.7 million under-16 accounts in five weeks. Parents report ~70% of under-16s still accessing social. Both figures are official and both are true - they measure different things.
The martech market stopped growing
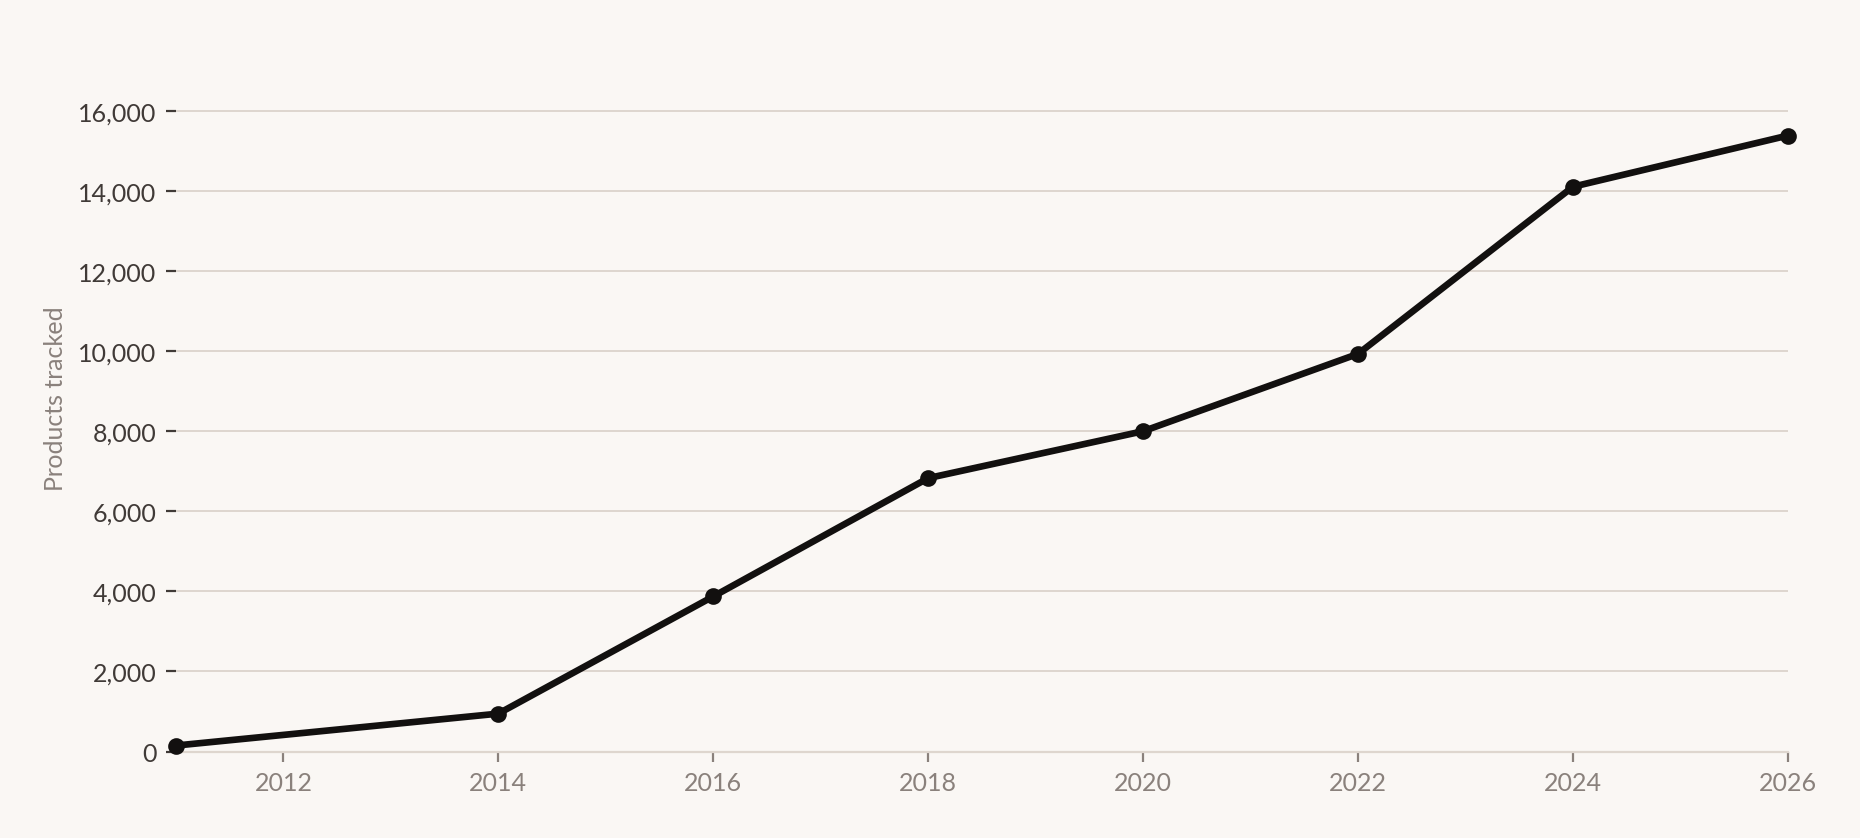
The stack stopped expanding. What replaced expansion is more interesting.
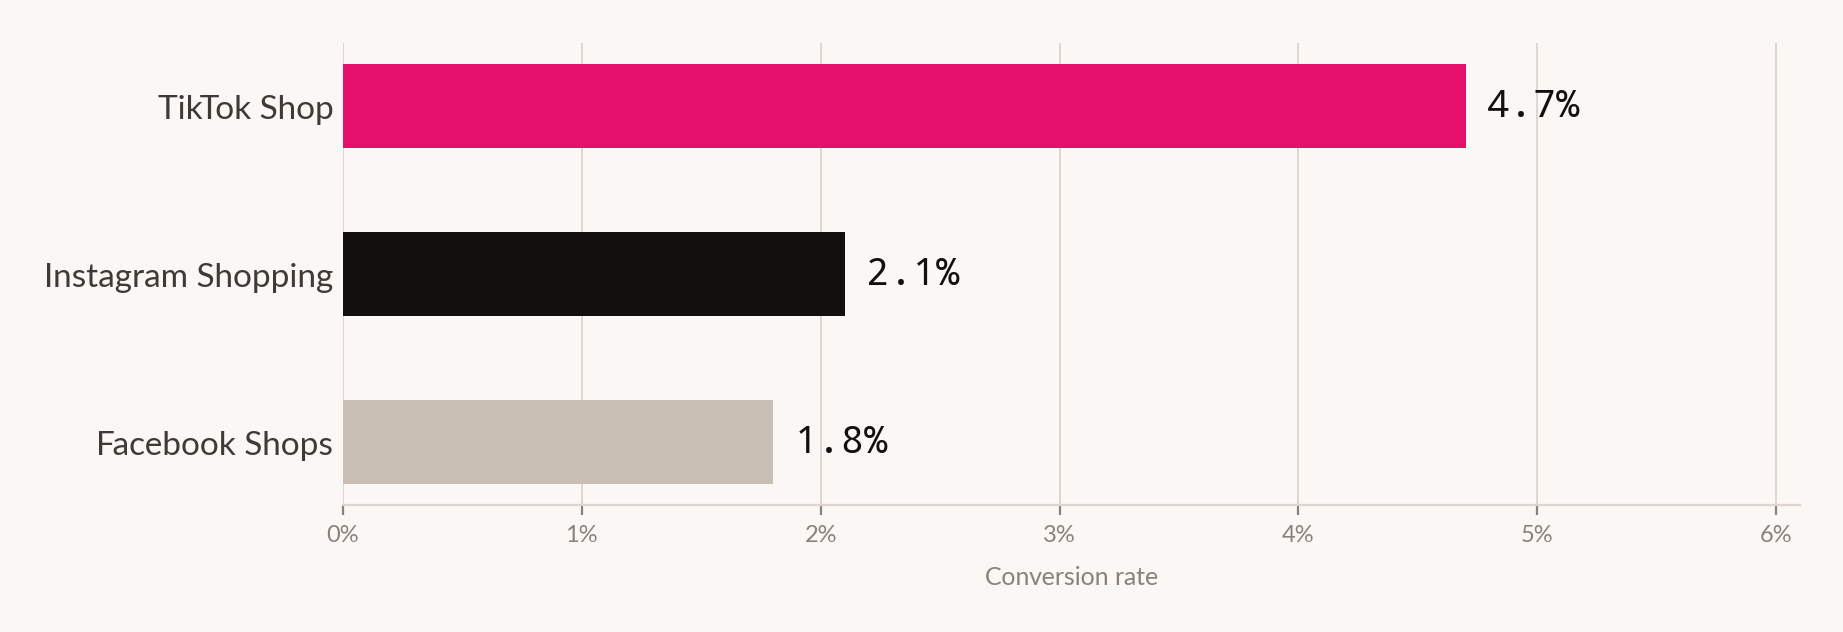
TikTok Shop converts more than twice as well
TikTok Shop converts at 4.7%. Instagram Shopping at 2.1%. Facebook Marketplace at 1.8%. The spread separates a channel that closes from ones that do not.
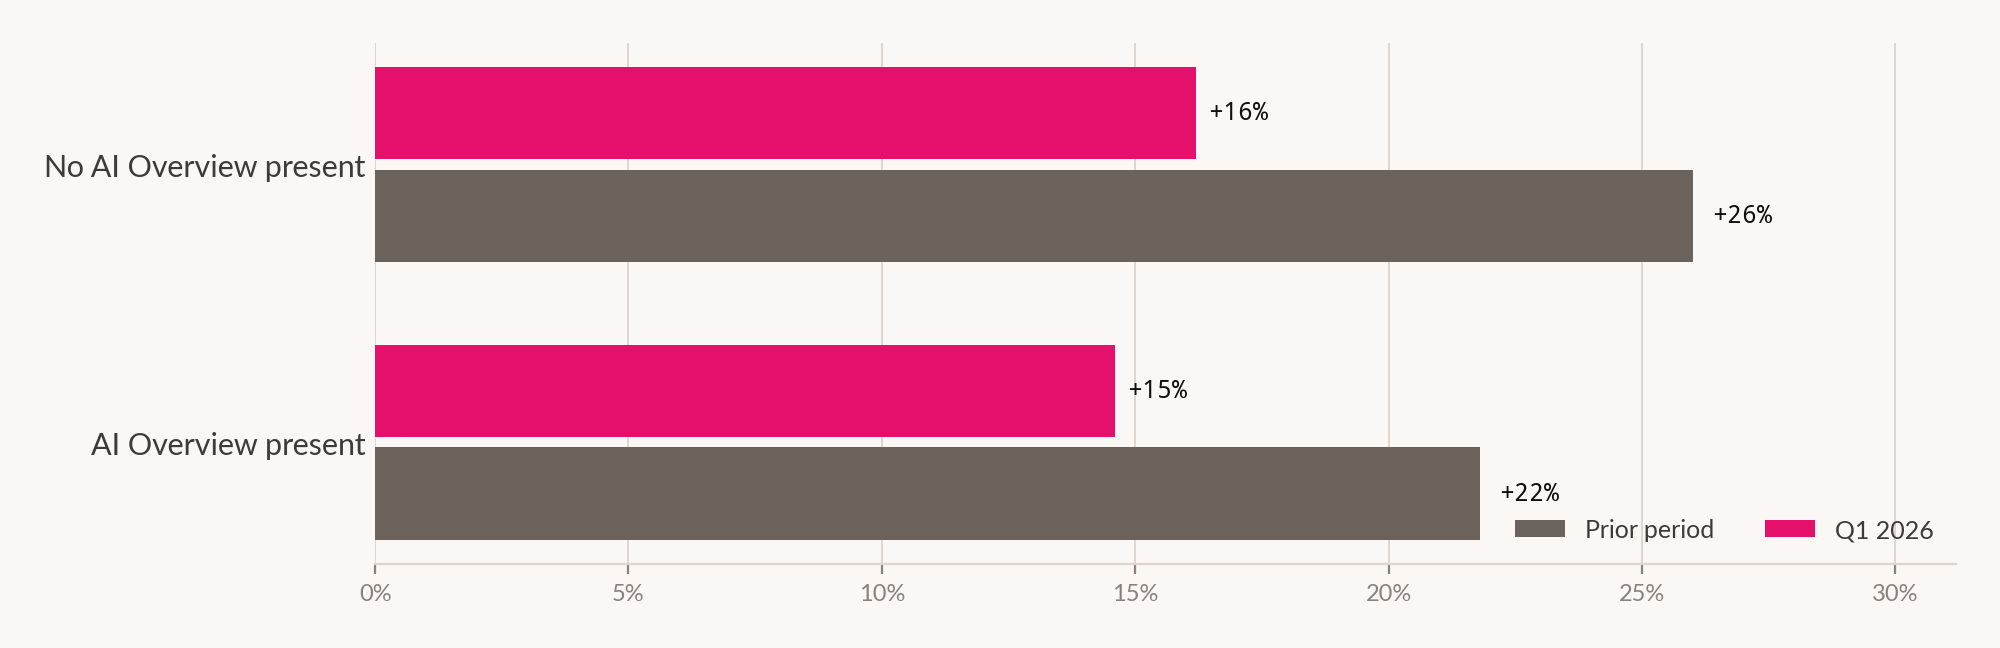
Paid search grew while search shrank
An answer layer sits between the query and the result. Paid search grew anyway.
One issue a quarter.
Nothing in between.
Every edition collects the quarter's features and reports across all seven desks into a single issue. No weekly send, no roundups.