
Start with the aggregate, because the anecdotes have made this harder to see rather than easier.
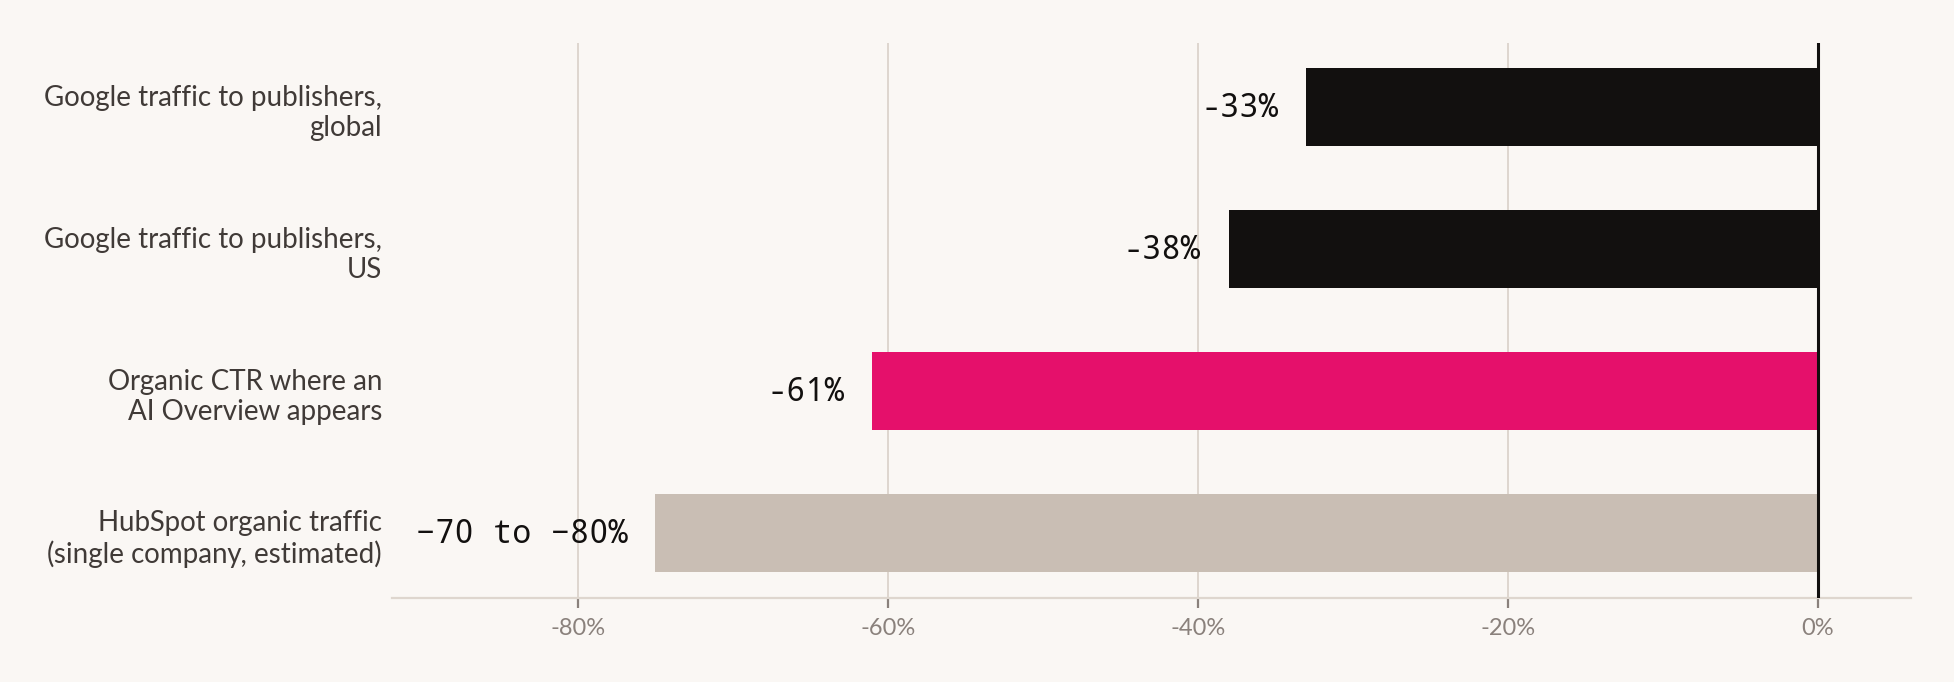
Google search traffic to publishers fell 33% globally in the year to November 2025. In the United States it fell 38%.1
Underneath that average, individual outcomes vary enormously. Publishers report losses of 20%, 30% and in some cases as much as 90% of traffic and revenue over the past year.1 HubSpot - a company whose content operation was widely treated as the reference implementation of the discipline - is estimated to have lost 70 to 80% of its organic traffic.1
A third of a channel disappearing in twelve months is not a trend. It is a structural break, and the language the industry is using has not caught up with it.
The mechanism, stated plainly
The cause is not mysterious. Roughly 48% of searches now return an AI Overview, and where one appears, organic click-through rate fell 61%.1
The answer arrives on the results page. The click that used to follow it does not.
Zero-click behaviour is now the majority case in general: about 60% of searches globally end without a click, rising to 77% on mobile.1 Mobile is the more important number and the one most reporting buries, because mobile is where the majority of consumer search happens.
Two authoritative figures point in opposite directions
Here the evidence gets genuinely difficult, and we are going to show the difficulty rather than resolve it.
One widely reported figure holds that where an AI Overview is present, 83% of those queries end without any click at all, rising to 93% in Google's AI Mode.1
A second, from Semrush data, holds that the zero-click rate on keywords featuring AI Overviews fell from more than 45% in January 2025 to 38% by October.1
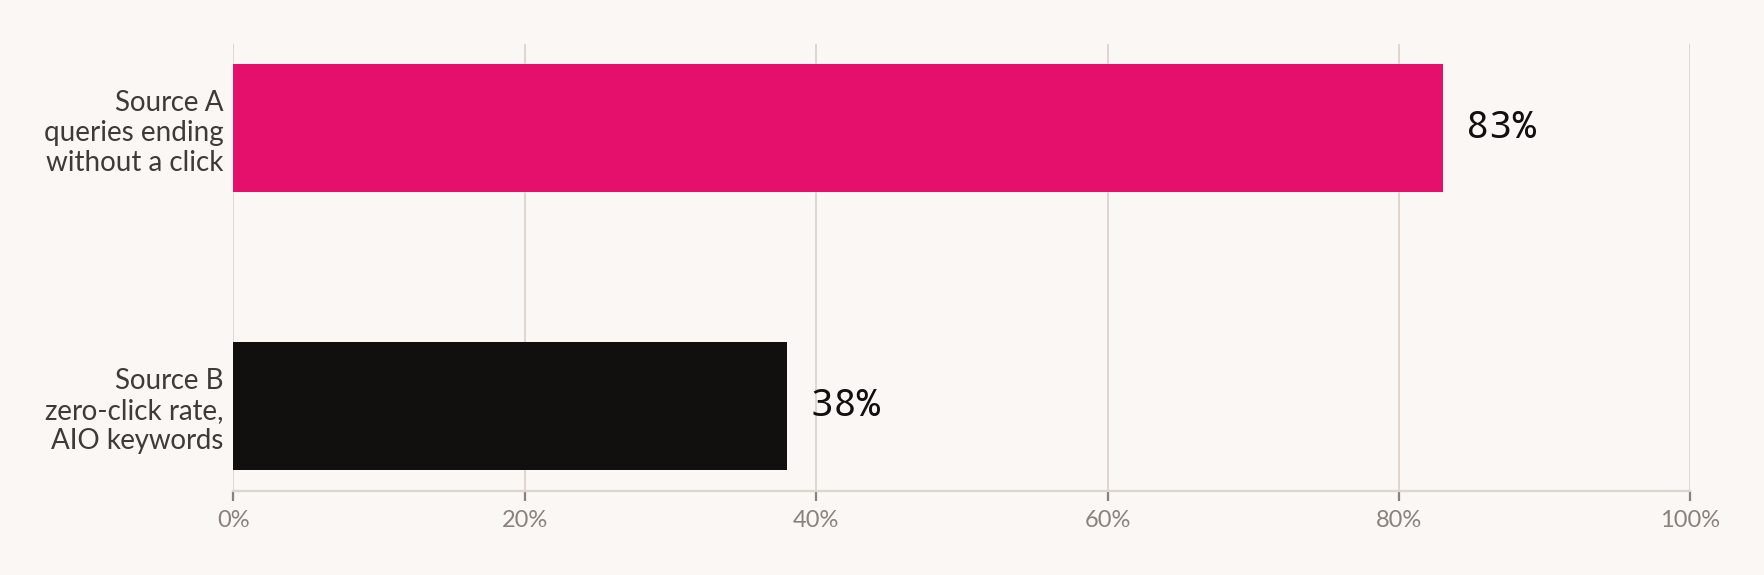
This matters more than it looks. These are not a vendor claim against a study - they are two measurements of the same phenomenon in the same period, and a 45-point gap between them is larger than most of the effects being argued about.
The plausible reconciliations are all definitional. "Zero-click" may mean no click on any result, or no click on an organic result, or no onward navigation of any kind. The samples may be all queries, or tracked keyword sets, or informational queries only. Any of these would produce a wide divergence, and none of them is disclosed in the coverage we could reach.
What we are doing about it
We are reporting both figures and declining to pick one. That is unsatisfying and it is the honest position. A publication that resolved this by choosing the more dramatic number would be doing PR, not research. If either party publishes its methodology, the question becomes answerable in an afternoon.
The decline is not evenly distributed
Aggregate figures conceal who is actually being hit. Sites in health, finance and education lost 11 to 23 percentage points of organic click share.1
Those three verticals share a property. They are the categories where a searcher wants a direct answer to a factual question - a dosage, a rate, a deadline - and where the answer is short enough for a generated summary to deliver completely. There is nothing left for the click to do.
The queries did not disappear
A detail that gets lost in the traffic reporting: demand did not fall. People are still asking. AI search visits grew 42.8% year over year to 27.4 billion queries in Q1 2026, as Feature 22 of this desk sets out.
So the picture is not a market losing interest in information. It is a market whose questions are being answered at a different point in the journey, by a system that reads your page and does not send anyone to it.
That distinction determines whether this is a demand problem or a distribution problem, and it is emphatically the second. A demand problem would show up as fewer questions. This shows up as the same questions, answered elsewhere, using your material.
Nobody stopped wanting the answer. They stopped needing the page that contained it.
Where the remaining clicks go
Zero-click is a majority behaviour but not a universal one, and the residue is not random. Two categories reliably survive.
Transactional and navigational intent. A user who wants to buy, book, log in or download must reach a destination. A summary can describe the product; it cannot complete the purchase. This is why commerce and software sites report less severe declines than publishers, and why aggregate publisher figures overstate the effect for businesses whose search traffic was mostly people trying to reach them.
Queries where the answer is contested or deep. When a summary cannot resolve the question - because sources disagree, because the answer depends on circumstances, or because it is longer than a summary - the user continues to the source. This is the same property Feature 22 identifies in citation behaviour, arriving from the other direction.
Both survivals point the same way, and it is not the way most content operations are pointed. The exposed category is exactly the material the discipline industrialised: comprehensive, well-structured, top-of-funnel explanation of things that have a settled answer.
Why this is worse than a platform update
Search referral has been disrupted before - Panda, Penguin, the mobile shift, featured snippets. Every one of those redistributed traffic between publishers. Some sites lost, others gained, and the discipline's response was to work out what the new ranking preference was and satisfy it.
This is different in kind. The traffic is not moving to a different set of publishers. It is not arriving anywhere. The user's need is being met on the results page, and the visit that used to be the unit of value has been removed from the transaction.
Previous updates changed who got the click. This one removed the click.
That distinction determines whether the standard response works. "Improve the content and recover the ranking" is sound advice when traffic has been redistributed. It is not advice at all when the click has been eliminated for that query class, and a team executing it will produce better content, rank higher, and see no recovery.
What to do about it
Re-segment your content by exposure, not by topic. The question is not which pages lost traffic; it is which pages a generated summary can fully substitute for. That set will keep losing regardless of quality, and the budget attached to it is the budget to reallocate.
Stop reporting sessions as the headline. If a third of the channel is gone for structural reasons, a dashboard whose primary metric is sessions will report failure every month for reasons the team cannot act on. Feature 26 of this desk sets out what to report instead.
Re-baseline before you set targets. Any content plan carrying pre-2025 traffic assumptions contains an error you can quantify today. This is the same argument Feature 01 makes about media costs: last year's number is a record, not a forecast.
Do not conclude that content stopped working. The distribution channel changed. Feature 22 shows that citation and ranking have decoupled, and Feature 23 shows that citations overwhelmingly come from earned media. Those are routes, and they are open.
Ask which of the two zero-click figures your own data supports. You have query-level data that neither published source has. The disagreement in Figure 02 is unresolvable at industry level and entirely resolvable inside your own analytics.
| Measure | Value | Grade |
|---|---|---|
| The decline | ||
| Google traffic to publishers, global, to Nov 2025 | −33% | Reported |
| Google traffic to publishers, US | −38% | Reported |
| Range of individual publisher losses | −20% to −90% | Reported |
| HubSpot organic traffic | −70% to −80% | Third-party estimate |
| Organic CTR where an AI Overview appears | −61% | Reported |
| Health, finance, education click share | −11 to −23pp | Reported |
| Prevalence | ||
| Searches returning an AI Overview | 48% | Reported |
| Zero-click searches, global | ~60% | Reported |
| Zero-click searches, mobile | 77% | Reported |
| The unresolved conflict | ||
| AIO queries ending without a click | 83% | Source A |
| AI Mode queries ending without a click | 93% | Source A |
| Zero-click rate, AIO keywords, Oct 2025 | 38% | Source B - and falling |
How we did this
What this doesn't prove
- The true zero-click rate. Two sourced figures disagree by 45 points. This feature documents the disagreement rather than settling it.
- That AI Overviews caused the whole decline. The correlation is strong and the mechanism plausible, but the period also contains ordinary algorithm changes, and no source decomposes the 33% into causes.
- That HubSpot's loss is representative. It is one company, estimated by third parties, in the most exposed content category. It illustrates a range; it does not define one.
- Revenue impact. Traffic is not revenue. A page losing 60% of visits may lose far less or far more margin depending on what those visits were worth, and no source we found models this.
- That the exposure classification in Figure 03 predicts outcomes. It is reasoning about substitutability, untested against traffic data.
- Anything outside Google. This is a Google-referral story. Other referral sources are not covered.
Sources for this feature
- Publisher traffic decline, AI Overview prevalence, zero-click and vertical click-share data, 2026. adexchanger.com, searchenginejournal.com, omnibound.ai, thedigitalbloom.com A named study, reported by someone else, or a company that sells into this market - trade reporting and compilations
- Features 01, 22, 23 and 26 of this edition. Another feature in this edition