
The consensus position on AI in search is that it is a subtraction. The answer arrives at the top of the page, the user's question is resolved, and the click that used to follow does not happen. Publishers have the receipts: organic click-through on queries carrying an AI Overview has fallen roughly 61%, from about 1.76% to 0.61%.1 Field experiments have put publisher click losses in the region of 40%.
AI Overviews now appear on approximately 48% of tracked queries, up from 31% a year earlier.2 Nearly half of search has an answer sitting above the results.
Against that, the Q1 2026 paid search data reads like a different market entirely. Google paid search clicks grew 14% year over year - the strongest click growth in nearly two years, and by some measures a five-year high - with average CPC flat.3 Text ads grew clicks 11%. Shopping grew clicks 18%.
Half of search is being answered before the results load, and advertisers bought 14% more clicks than a year ago at the same price.
Both statements are supported. The reconciliation is not that one dataset is wrong - it is that the answer layer is doing something quite specific to the page, and it is not doing the same thing to paid as it is to organic.
What is actually happening to paid click-through
The most useful evidence comes from Seer Interactive, which has tracked paid and organic click-through segmented by AI Overview presence across 2025 and into 2026. Their Q1 2026 update contains the finding that reframes the whole discussion.
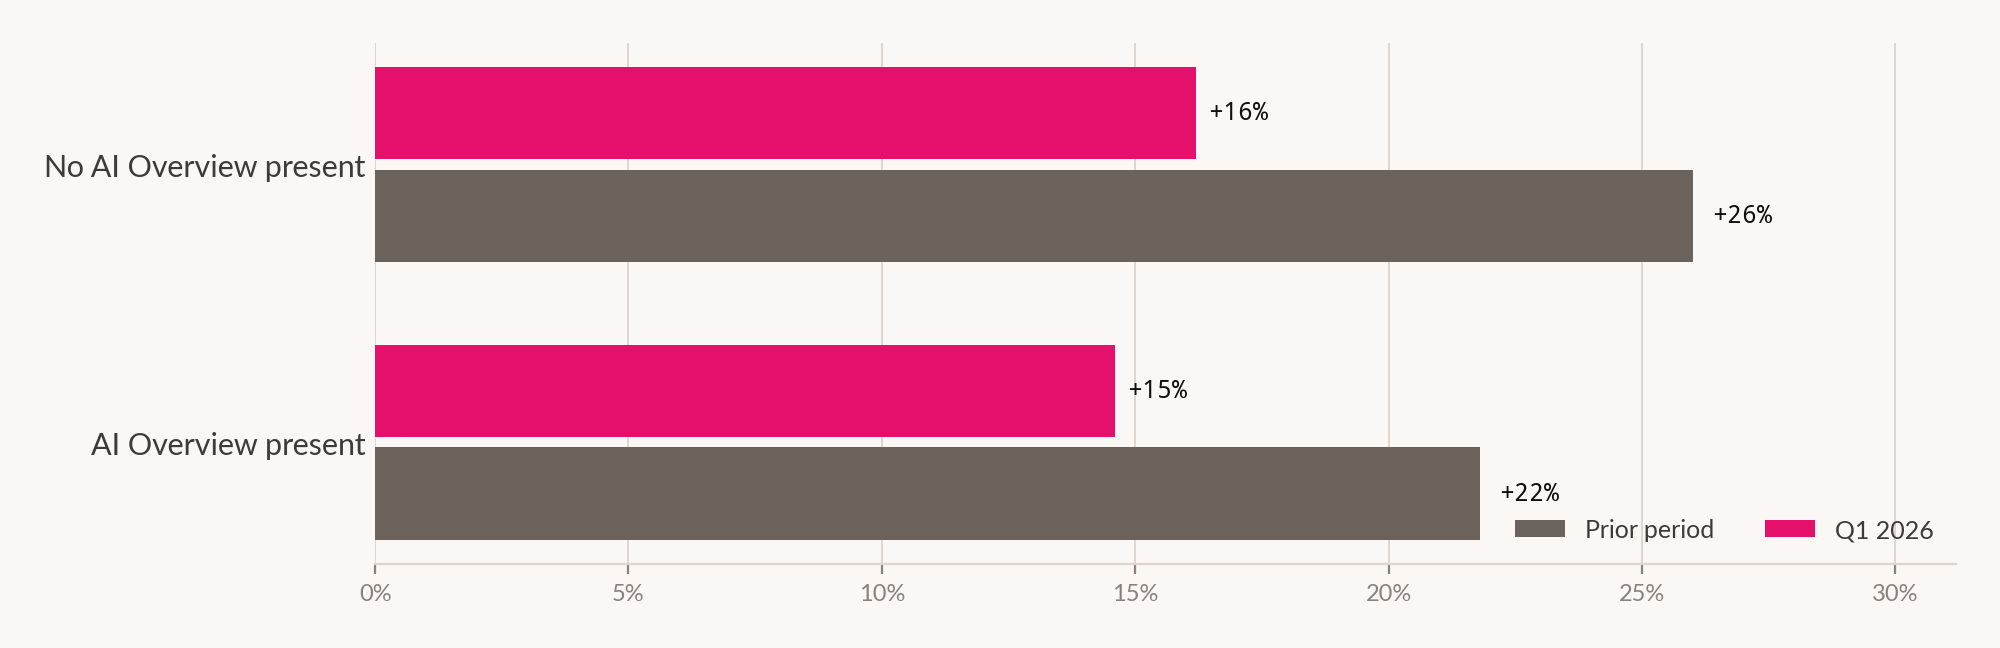
Paid CTR on queries where an AI Overview appears rose from 14.6% to 16.2%. Over the same period, paid CTR on queries without an AI Overview fell from 26% to 21.8%.1
The two curves are converging, and they are converging from opposite directions. AI Overview queries are becoming better for paid. Non-AI Overview queries are becoming worse for paid.
The most plausible mechanism
An AI Overview occupies the top of the results page and pushes the traditional organic listings down. The paid unit generally sits above or immediately adjacent to the answer block.
The effect is that on an AI Overview query, the ad is no longer competing for attention with ten organic results. It is competing with one answer - and it is frequently the first clickable commercial option on the page. Organic listings, which used to absorb the majority of clicks, have been displaced below a large content block that satisfies many informational intents outright.
Organic loses badly in that arrangement. Paid loses much less, and on the evidence above, gains slightly.
The decline in paid CTR on non-AI Overview queries is harder to explain and we will not pretend otherwise. One possibility is query-mix: as Google extends AI Overviews to more informational queries, the residual non-AIO set becomes proportionally more navigational and transactional, where user behaviour differs. That is a hypothesis consistent with the direction, not a finding.
The finding that changes budget structure
The second Seer result is the one with operational consequences, and it has had comparatively little attention.
Brands cited inside an AI Overview receive 35% more organic clicks - and 91% more paid clicks.1
On informational queries specifically, a cited brand averaged 15.74% paid CTR against 11.19% when the brand was not cited in the Overview.
Take that caveat seriously, because it is doing real work. Nobody has randomised citation status. The brands that get cited are, on average, the brands with better content, more third-party coverage and stronger brand recognition - and every one of those factors lifts paid CTR on its own.
But even under the most conservative reading, something important follows. Citation status and paid performance move together. Whether the citation causes the clicks or merely marks the brands that were going to get them, the practical implication for how a marketing budget is organised is the same.
Paid and organic stopped being separable
The traditional division of labour treats paid search and organic search as substitutes managed by different people against different targets. Paid buys clicks now. Organic earns clicks later. They share keywords and little else.
That division assumed the two channels occupied separate real estate on the page. In an AI Overview result they do not. The Overview draws from organic-style sources and sits directly above the paid unit, and the presence of your brand in one is associated with a materially different outcome in the other.
Under those conditions, an organic content investment has a measurable paid return, and a paid budget is partially determined by an organic asset. Reporting them separately, to separate owners, on separate targets, will produce a specific and predictable error: it will underfund the work that improves both.
A conflict in the evidence, stated rather than resolved
Some 2026 coverage reports paid CTR declines of around 68% on AI Overview queries - which appears to contradict the Seer figures showing paid CTR on those queries rising to 16.2%.
We think these are measuring different things. A 61% organic and 68% paid decline are most likely relative declines against the same query's pre-AI-Overview baseline, drawn from an earlier study period. The Seer figures are absolute CTR levels segmented by AIO presence in Q1 2026. A metric can fall sharply against its own history while sitting above the comparison group in the current period.
We have not been able to reconcile the two definitively from the material available. Where sources conflict and we cannot resolve them, our practice is to report both and mark the disagreement rather than choose the one that fits the argument. Treat the direction of the Seer trend as better evidenced than any specific magnitude.
The brand CPC puzzle
One further Q1 2026 figure sits oddly and deserves flagging even though we cannot explain it confidently.
Brand keyword CPCs declined 9% year over year while overall paid search clicks grew 14%.3 Brand terms getting cheaper during a period of rising search volume is not the default expectation.
Several mechanisms could produce it. More brand query volume would increase auction supply and soften prices. Competitors reducing conquesting bids on brand terms would do the same. An AI Overview that answers a brand question directly - opening hours, returns policy, specifications - might reduce clicks on the most competitive brand queries while leaving cheaper long-tail brand traffic in the mix, dragging the average down.
We flag it because it is a real number moving in an unintuitive direction and because it is measurable in any individual account within a week. If your brand CPCs fell in Q1, the diagnostic question is whether your brand impression volume rose at the same time. If it did, you are looking at supply. If it did not, something changed about which brand queries are reaching the auction at all.
Three channels, one budget line
The structural point underneath all of this is that Google is now serving three distinct channels for the same query - classic Search, AI Overviews, and Gemini/AI Mode - each ranking pages, citing sources and converting users differently.2
Most paid search reporting still treats "Google Search" as one destination. It is not, and the differences are not cosmetic:
- Classic search results - the environment every paid search benchmark was built in. Ten organic listings, ads above and below, click behaviour well understood.
- AI Overview results - answer block on top, organic pushed down, paid relatively more prominent, citation status coupled to paid CTR.
- AI Mode / Gemini - a conversational channel with different citation behaviour again, and the least public data of the three.
An account-level CPC or CTR average now blends three environments with materially different mechanics. That average will move for reasons that have nothing to do with anything the advertiser did - specifically, it will move as Google changes the proportion of queries served by each channel.
| Metric | Change | Note |
|---|---|---|
| Google paid search | ||
| Spend | +14% | Highest growth in nearly two years |
| Clicks | +14% | Five-year high by some measures |
| Average CPC | 0% | Flat despite click growth |
| Text ad clicks | +11% | CPC +1% |
| Shopping clicks | +18% | CPC flat |
| Brand keyword CPC | −9% | Unexplained - see above |
| The answer layer | ||
| AI Overview query penetration | 48% | From 31% a year earlier |
| Organic CTR, AIO queries | −61% | 1.76% → 0.61% |
| Paid CTR, AIO queries | 14.6% → 16.2% | Rising |
| Paid CTR, non-AIO queries | 26% → 21.8% | Falling |
| Paid clicks if brand cited | +91% | Correlation, not causation |
What to do about it
Segment paid reporting by AI Overview presence. This is now the single most informative cut available in paid search, and blended reporting hides it entirely. If your tooling cannot segment by AIO presence, that is the capability gap to close this quarter - not a new bidding strategy.
Treat citation status as a paid media asset. Whether the 91% figure is causal or correlational, the brands appearing in AI Overviews are performing materially better in the paid auction on the same queries. Knowing which of your commercial queries return an Overview, and whether you appear in it, is now a paid search input rather than an SEO curiosity.
Stop reporting paid and organic to separate owners against separate targets. The page no longer separates them. A structure that does will systematically underfund whichever investment improves both - and on current evidence that is content and citation-worthiness rather than bids.
Re-baseline benchmarks by channel. Any CTR or CPC benchmark predating widespread AI Overviews describes a page layout that now applies to roughly half of queries. Comparing this quarter's blended CTR to a 2023 benchmark is comparing two different products.
Check your brand CPC against your brand impression volume. A one-week diagnostic that will tell you whether the 9% brand CPC decline in the sample is happening in your account, and if so which mechanism is producing it.
How we did this
What this doesn't prove
- That AI Overviews caused paid search growth. Click growth of 14% coincided with AIO expansion. Coincidence is all we can demonstrate; ad load changes, query growth and auction dynamics are equally plausible contributors and are not separable in public data.
- That being cited causes more paid clicks. The association is strong and the confound is obvious. Until someone randomises citation status, this remains correlation.
- Anything about conversion. Every figure here is a click metric. A higher CTR on AI Overview queries says nothing about whether those clicks convert better, worse or identically.
- Why paid CTR fell on non-AIO queries. Our query-mix explanation is a hypothesis. We have no data segmenting the residual non-AIO query set by intent type.
- Why brand CPCs fell 9%. We list three candidate mechanisms and endorse none. It is flagged as unexplained deliberately.
- Anything about AI Mode or Gemini as an ad channel. It is the least publicly measured of the three channels and we found no reliable paid performance data for it.
- Anything outside the US. AI Overview rollout, penetration and behaviour vary substantially by market and language.
Sources for this feature
- Seer Interactive, AI Overview CTR analysis and April 2026 update - paid and organic CTR segmented by AIO presence, and citation-effect findings. A named study, reported by someone else - named practitioner study, via published summaries
- BrightEdge, AI Overview query penetration, approx. February 2026, via industry coverage. A named study, reported by someone else
- Tinuiti, Digital Ads Benchmark Report, Q1 2026. tinuiti.com Straight from the source
- Field experiment on AI Overview publisher click impact, 2026, via industry coverage. A named study, reported by someone else
- Conflicting paid CTR decline figures as circulated in 2026 trade coverage. From a company that sells into this market - unreconciled