
For most of the last fifteen years the marketing technology landscape has been the industry's favourite illustration of abundance. A chart that began with roughly 150 logos in 2011 and grew, year after year, into an unreadable wall of thousands. Every version of it was met with the same two reactions: astonishment, and a joke about needing a bigger slide.
The 2026 edition breaks the pattern. The ecosystem sits at 15,505 products, having grown 0.79% over the previous year.1
That is not growth. Rounded to the nearest hundred products, it is a flat line.
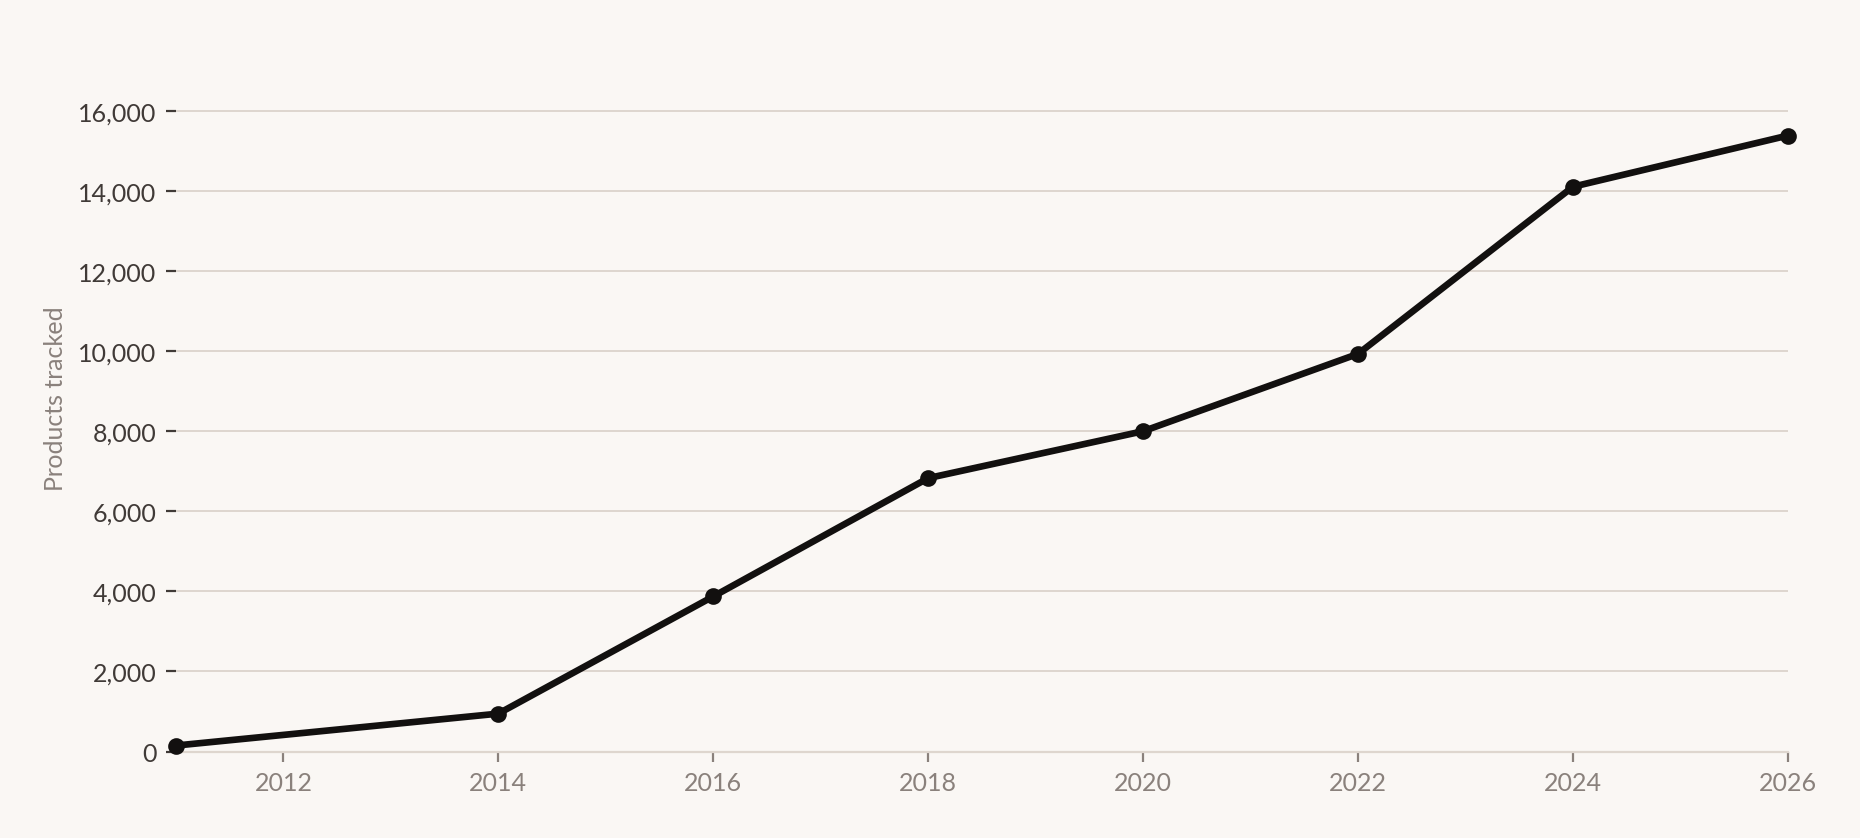
The obvious explanation is market saturation: every category has been built, so new entrants have nowhere to go. That explanation is comfortable and almost certainly wrong, because it does not fit what is happening to the tools that already exist.
Half of martech spend produces nothing
Martech utilisation has fallen to 49%.1 Roughly half of every dollar spent on marketing technology generates no active output - capability licensed, deployed, and not used.
The performance picture is starker still. Under Gartner's framework, only 15% of organisations qualify as high performers - meeting strategic goals and demonstrating positive ROI from their martech investment.1
A market does not stop growing because it is finished. It stops growing because buyers have discovered that the last three thousand products did not work.
Read together, the two datasets describe a correction rather than a maturation. Buyers spent a decade acquiring point solutions on the assumption that a capability gap could be closed by purchasing a capability. Half the resulting stack is inert. Only 15% of organisations can show it paid. New vendors are consequently finding it very hard to sell - which is what a 0.79% growth rate looks like from the supply side.
Why consolidation this time is different
Martech consolidation is not a new theme. It has been predicted after every downturn for a decade and has never much happened, because cutting tools breaks workflows and the political cost usually exceeds the licence saving.
Three things make the 2026 version behave differently, and only one of them is budget.
1. Finance has a number now
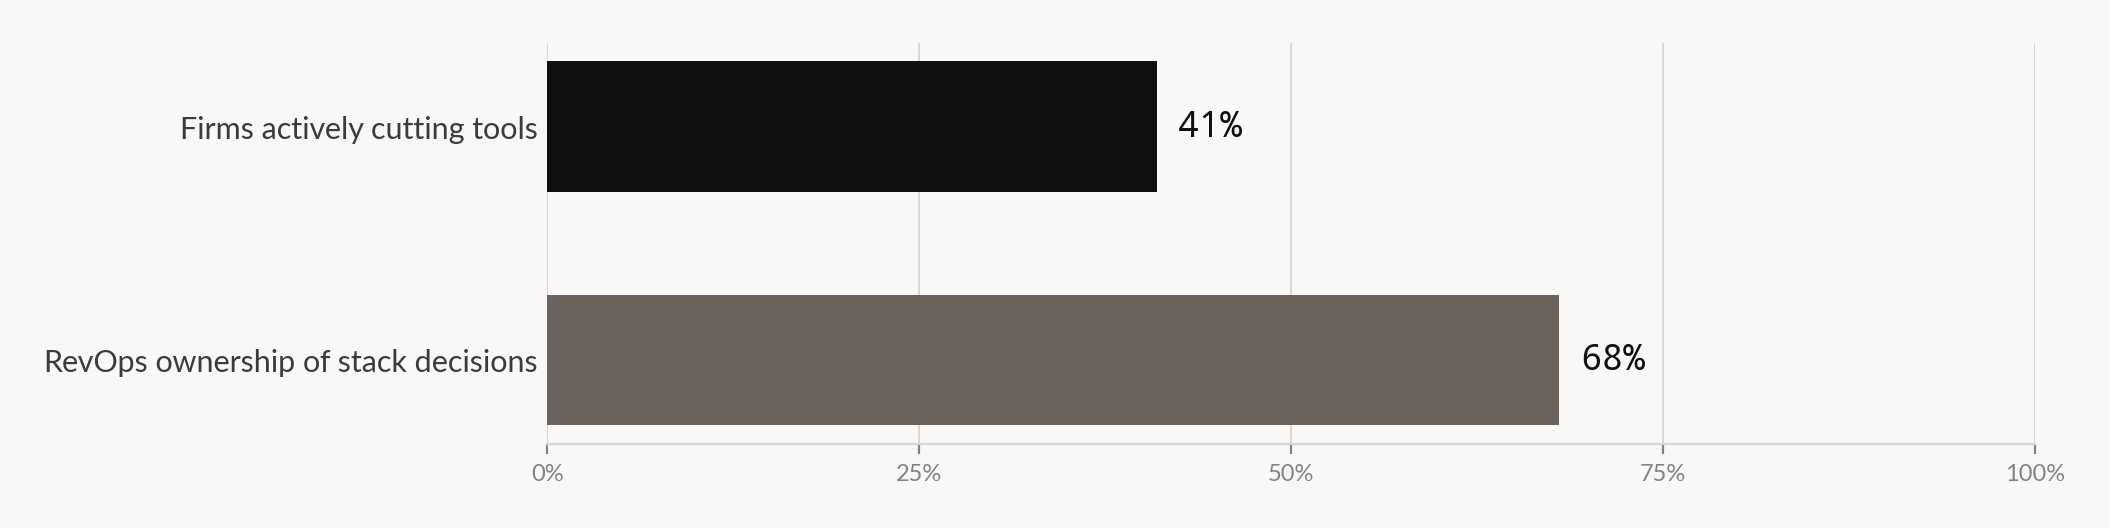
41% of firms are actively cutting tools, under a 3–5× ROI mandate.1 The significant part is not the cutting; it is the mandate. A CFO asking marketing to justify tools is routine. A CFO issuing a specific multiple that each tool must return is a different instrument, because it converts a qualitative argument about capability into an arithmetic one that a marketer either passes or fails.
2. The buyer changed
RevOps now owns 68% of stack architecture decisions, up from 42% in 2023.1 That is a 26-point transfer of purchasing authority in three years, and it changes what gets bought.
A marketing team buys capability - the thing the tool does. A RevOps function buys architecture - how the tool fits, what it writes to, what breaks if it is removed. Point solutions sell well to the first buyer and badly to the second, and the second buyer now decides.
3. AI made point solutions redundant
The third driver is the one that makes this permanent rather than cyclical. A large share of the 15,505 products exist to perform a discrete task - generate a subject line, resize a creative, summarise a call, score a lead. Those are precisely the tasks a general-purpose model now performs adequately, inside a tool the organisation already pays for.
Generative AI tools are now used by 68.6% of organisations, making them the sixth most popular martech category overall.1 When a horizontal capability reaches two-thirds penetration, the vertical products built to deliver a narrower version of that same capability lose their reason to exist.
Consolidation as an AI prerequisite
Here is the argument that reframes the whole exercise, and it is the most useful idea in this feature.
Consolidation in 2026 is not a cost-cutting exercise. It is the prerequisite for a functional AI marketing architecture, because AI models require clean, unified, accessible data to function.1
The organisations where AI-powered marketing is actually working at scale are the ones that moved to unified data environments - typically a cloud data warehouse as a single source of truth, with specialised tools writing to and reading from it rather than maintaining separate stores.1
This inverts the usual sequencing. Most organisations are attempting to bolt AI onto a stack of forty tools each holding its own partial copy of the customer, and then concluding that AI underdelivers. The models are not underdelivering. They are being asked to reason across a data estate that no human could reason across either.
Every dormant tool in a stack is not merely wasted licence cost. It is a fragment of customer data sitting somewhere the model cannot reach.
That reframing turns consolidation from a defensive move into an enabling one - and it explains why the tools being cut are not necessarily the least useful ones. They are the ones that do not participate in the shared data layer.
Where innovation actually moved
If new logos are not the innovation story, what is? The most coherent answer available comes from Scott Brinker's State of Martech 2026, which argues the composable landscape is stratifying into distinct layers: AI-native tools handling creation, orchestration consolidated under a unified platform activating data from a single source of truth, and proprietary intelligence built where competitive advantage lives.2
Creation - AI-native tools
Generation of assets, variants, copy and analysis. Rapidly commoditising, increasingly bundled, and the layer where switching costs are lowest. Buy here, do not build, and expect to change vendors.
Orchestration - consolidated platform
Journey, activation and decisioning, running on data drawn from a single source of truth rather than a private store. This is the layer consolidation is actually about. Consolidate here, and make participation in the shared data layer the criterion for staying.
Proprietary intelligence - build
The models, features and decision logic derived from data nobody else has. The only layer where a tool purchase cannot produce advantage, because anything purchasable is available to competitors on the same terms.
The practical consequence of stratification is that "what tools should we use" has become a badly formed question. The right question is which layer a given capability belongs in - because the correct answer at layer one (buy the cheapest adequate thing, expect to replace it) is the wrong answer at layer three (build it, because purchased advantage is not advantage).
The agent layer sits awkwardly across all three
One category resists this framing, and it is the one attracting the most attention: 90.3% of marketing teams now use AI agents somewhere, but only 23.3% run them in full production, and 80.6% keep them in assist-only mode.1
Near-universal adoption alongside near-universal restriction is an unusual pattern and it does not fit the stratification model cleanly - agents touch creation, orchestration and decisioning simultaneously. That gap between adoption and trust is substantial enough to warrant its own treatment, and Feature 10 of this edition takes it.
| Measure | Figure | Note |
|---|---|---|
| Market structure | ||
| Products in the landscape | 15,505 | - |
| Year-on-year growth | +0.79% | Effectively flat |
| Top-6 Q1 2026 tech deals that were AI-driven | 4 | Consolidation by acquisition |
| Utilisation | ||
| Stack utilisation | 49% | Half of spend produces no output |
| Organisations qualifying as high performers | 15% | Gartner framework |
| AI penetration | ||
| Organisations using generative AI tools | 68.6% | 6th most popular martech category |
| Teams using AI agents somewhere | 90.3% | See Feature 10 |
| Running agents in full production | 23.3% | - |
| Keeping agents assist-only | 80.6% | - |
| Buying | ||
| Firms actively cutting tools | 41% | Under a 3–5× ROI mandate |
| RevOps share of stack decisions | 68% | Was 42% in 2023 |
What to do about it
Audit for participation, not for usage. The standard consolidation exercise ranks tools by seat count or login frequency and cuts the bottom. The better test is whether a tool writes to and reads from your shared data layer. A lightly used tool that participates is worth more to an AI architecture than a heavily used one that hoards.
Fix the data estate before buying more AI. If AI initiatives are underperforming against a stack with 49% utilisation, the most probable cause is fragmentation rather than model quality. Buying a better model to reason over a worse data estate is the most expensive way to not solve this.
Assign every capability to a layer before you evaluate vendors. Layer one purchases should be cheap, adequate and expected to churn. Layer three should not be purchased at all. Most procurement pain comes from evaluating a layer-one tool with layer-three criteria, or the reverse.
Expect the vendor to be acquired. With four of the six largest Q1 2026 technology deals driven by the AI race, and a landscape that has stopped growing, the base rate of vendor consolidation is high. Contract terms and data portability now matter more than roadmap promises.
Treat 15% as the benchmark, not the exception. If only 15% of organisations demonstrate positive martech ROI, then the median organisation does not. Planning as though your stack is performing - because it was bought carefully and everybody uses it - is planning against the base rate.
How we did this
What this doesn't prove
- Why the landscape flatlined. Our disillusionment reading is one explanation. Funding conditions for early-stage software, acquisition activity removing logos, and changes in how the landscape is compiled would each produce a similar count.
- That consolidation improves outcomes. The argument that unified data is an AI prerequisite is well-reasoned and widely asserted. We found no controlled evidence that organisations which consolidated subsequently outperformed those that did not.
- That the 49% utilisation figure is comparable year to year. Without a stated methodology and a consistent panel, a single-year utilisation number cannot establish a trend.
- Anything about specific vendors. This feature makes no product recommendations and names no tools. The stratification argument is about layers, not logos.
- That AI caused point solutions to become redundant. Plausible and consistent with 68.6% generative AI penetration, but the counterfactual - how these categories would have fared without AI - is unobservable.
Sources for this feature
- Martech adoption statistics 2026 - market size, stack utilisation, AI integration, consolidation and ROI performance. shno.co From a company that sells into this market - compilation
- Scott Brinker, State of Martech 2026, stratification framework, via industry coverage. A named study, reported by someone else - named analyst framework
- Martech consolidation analysis 2026, various industry commentary. From a company that sells into this market
- Feature 10 of this edition, for the agent adoption gap. Another feature in this edition