
Two numbers from the same year, neither controversial on its own.
Content marketing budgets have risen to 26% of total marketing spend in 2026, with 61% of B2B marketers increasing spend.1
Google search traffic to publishers fell 33% globally over roughly the same period, as Feature 21 of this desk sets out.2
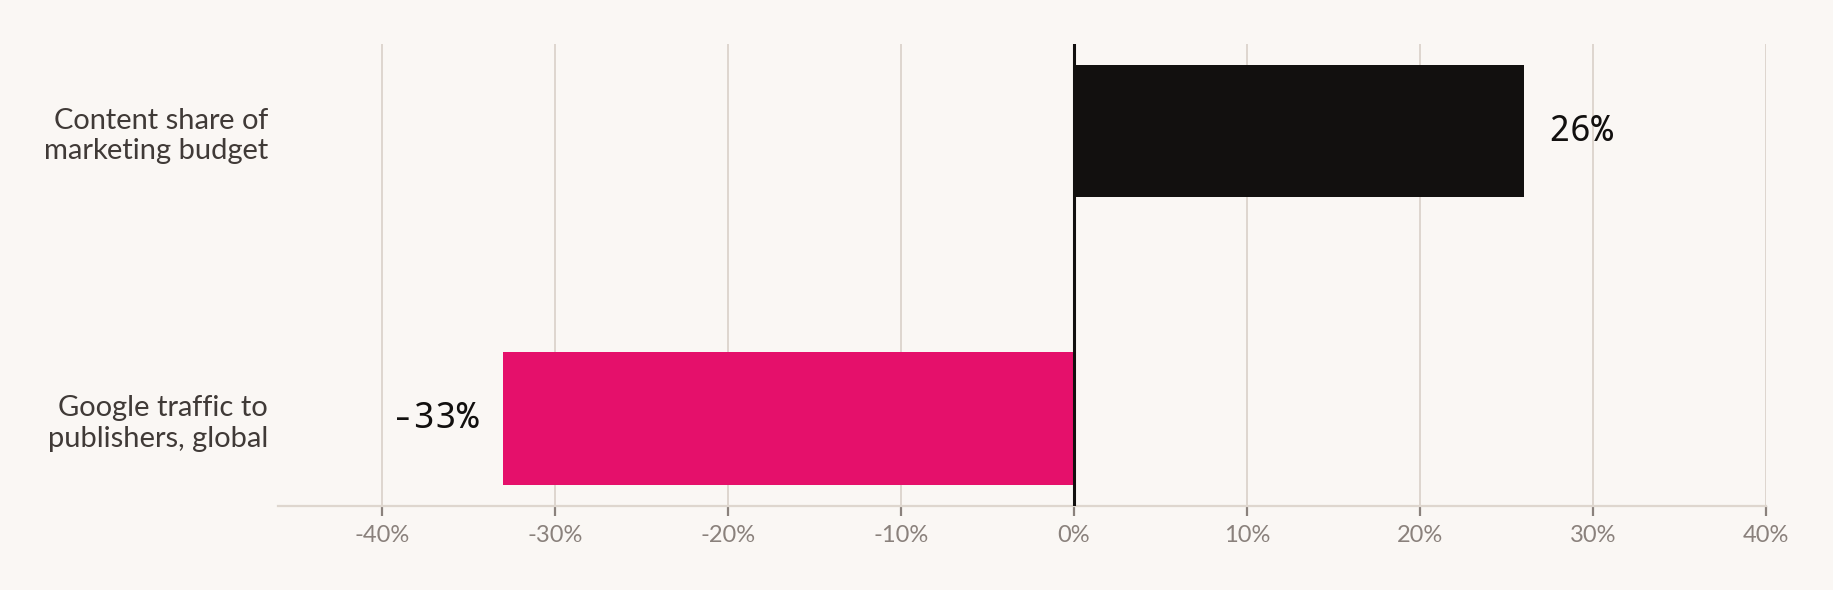
A quarter of the marketing budget is now going into a function whose main delivery route lost a third of its capacity in twelve months. That is not necessarily wrong. It is, however, a thing that ought to be said out loud in a planning meeting, and largely is not.
Three readings, and they are not equally good
The first reading is that this is a mistake - momentum spending, budget allocated on last year's performance because the reporting lag has not caught up. Some of it certainly is. Feature 21 shows that any plan carrying pre-2025 traffic assumptions contains a quantifiable error, and plenty of plans do.
The second is that content is doing something other than earning search traffic, and the search decline is therefore only partly relevant. Content feeds sales enablement, email programmes, product marketing, community, and - per Feature 23 - the earned-media base that generates AI citations. A function whose output serves six purposes does not become worthless when one of them degrades.
The third is that the increase is defensive. If organic visibility is harder to obtain, obtaining it costs more per unit. Spending more to hold the same position is not growth investment; it is inflation, and it looks identical in a budget line.
Rising spend against a contracting channel can mean confidence, diversification or inflation. The three are indistinguishable in a budget and they imply completely different decisions.
We cannot tell you which dominates. No research we found decomposes content budget growth by intent, and the distinction is not one that survey instruments currently ask about.
Where the money is actually going
Investment intent gives a partial answer, and it is more interesting than the headline.
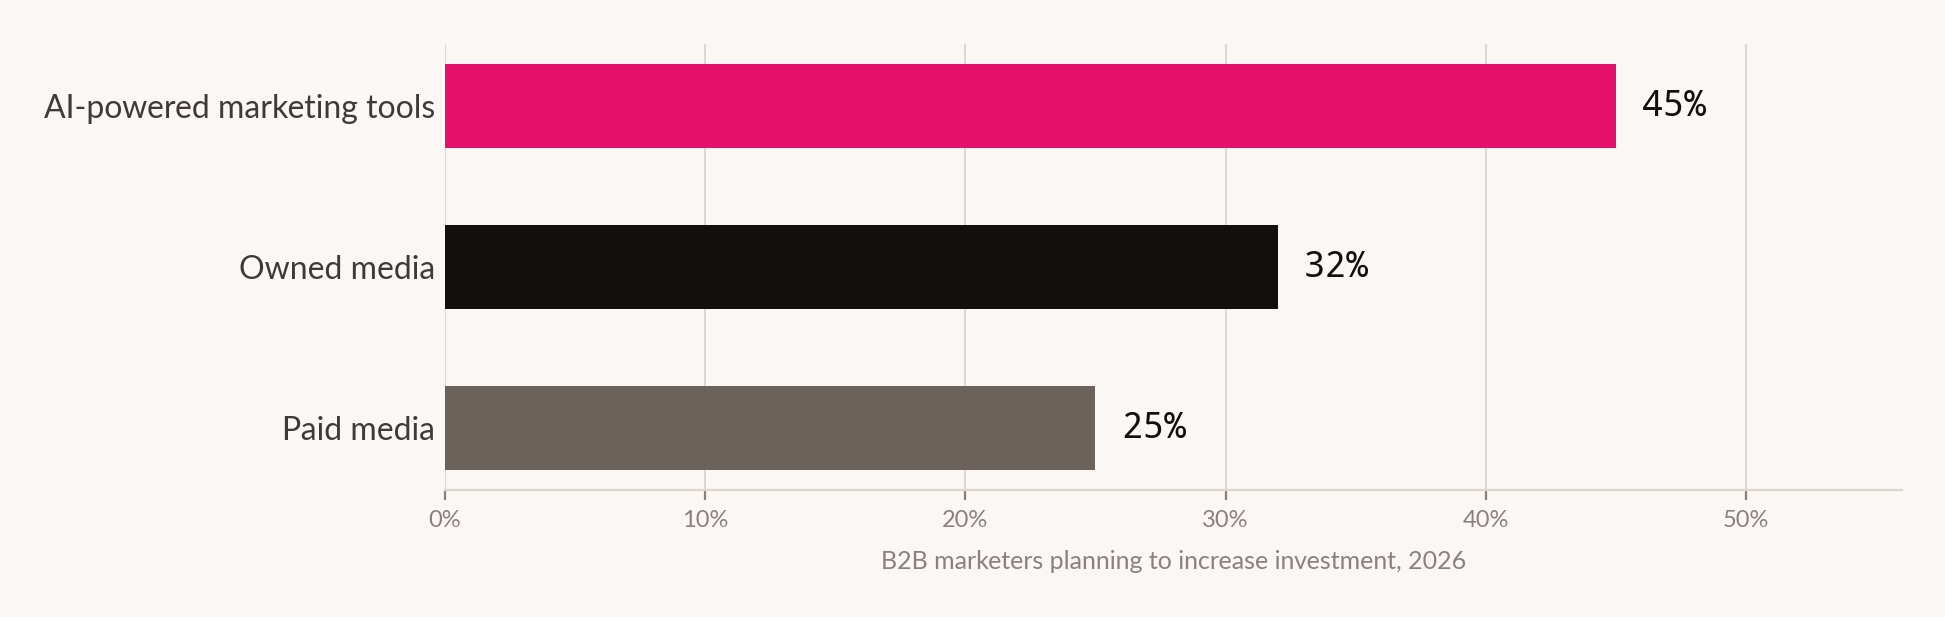
45% are increasing investment in AI-powered marketing tools. 32% in owned media. 25% in paid media.1
Tooling leads. That is consistent with what Feature 16 of the Creative desk found in production: the first response to pressure is to buy capacity rather than change what is being made. Cheaper production is a real gain and it is also the easiest thing to purchase, which is not the same as being the most useful thing to purchase.
The equilibrium nobody has worked out
Here is the structural question underneath, and it has an unusual shape.
Two things happened simultaneously. The cost of producing content fell sharply - Feature 16 of the Creative desk documents generative tooling reaching a third of assets, with vendor claims of order-of-magnitude cost reduction that we graded as unverified but directionally real. And the value of a unit of published content fell, because the traffic it used to earn has contracted by a third.
When both the cost and the value of a unit fall at once, the equilibrium quantity is indeterminate without knowing which fell faster. That is not an academic point - it determines whether the correct response is to publish more or publish less, and the industry has confidently adopted "more" without establishing the ratio.
The right-hand column is the one being under-weighted. Cheaper production is visible on an invoice. A contracting distribution channel shows up as a slow decline in a chart nobody owns.
The measurement gap that permits this
An industry can sustain a mismatch like this only if its reporting does not show it. Content reporting generally does not.
The standard content dashboard reports output and traffic: pieces published, sessions, time on page, keyword positions. In a stable channel that is adequate - output is an input measure, traffic is an outcome measure, and their ratio is roughly stable.
Neither survives this year. Output rises because production got cheaper. Traffic falls because the channel contracted. The ratio between them collapses, and a dashboard reporting both will show a team working harder for worse results with no indication of why or what to do.
What is missing is a measure of what content is for. Feature 26 of this desk takes that question directly.
Whose interest this serves
The budget and investment-intent figures in this feature come from content marketing industry sources and statistics compilations - publishers whose audience is content marketers and whose commercial interest lies in the category appearing healthy and growing. A figure showing content taking a rising share of budget is good news for everyone who reports it. Our own position is the same: Marketing Legendary operates a content practice and benefits from content budgets rising. This feature argues those budgets may be partly misallocated, which is at least an argument against our own short-term interest.
What the tooling budget is buying
The largest single investment intent is AI tooling at 45%, and it is worth asking what problem that spend solves.
Tooling addresses the cost of production. Feature 16 of the Creative desk examines this in detail and finds the same pattern: generative systems compress asset generation, variant production and iteration, while leaving review, approval and the decision about what to make entirely untouched.
Apply that to the content function specifically. The stages a content operation actually gets stuck at are subject selection, subject-matter access, approval, and distribution. Drafting is rarely the bottleneck in a functioning team, and where it is, the constraint is usually access to the person who knows the answer rather than the speed of writing it down.
So the 45% is being spent on the stage that was least binding, in a year when the binding constraint moved further away from production and further towards distribution.
Cheaper drafting in a market with a contracting distribution channel produces more unread material at lower unit cost, which is a worse outcome than less material at higher unit cost.
That is not an argument against the tooling. It is an argument that the tooling is a cost-side intervention being deployed against a demand-side problem, and that the two are being conflated because both are described as "investing in content".
The one place production cost genuinely matters
There is an exception worth naming, and it is the strongest case for the tooling spend.
Feature 23 established that citations come overwhelmingly from earned media, and that the most reliable route into that category is publishing original data others reference. Original research is expensive - it requires collection, analysis, verification and writing - and cheaper production genuinely lowers the cost of the surrounding work: the drafting, the variants, the summaries and the distribution assets that let one piece of research travel.
Tooling that reduces the cost of packaging original research is buying reach on the part of the channel that works. Tooling that reduces the cost of producing more explanatory content is buying volume in the category Feature 21 identified as most exposed.
Same invoice line. Opposite strategic effect. Almost no content budget distinguishes between them.
What to do about it
Ask which of the three readings applies to your increase. Confidence, diversification or inflation. If nobody in the planning conversation can say which, the increase is momentum.
Separate production budget from distribution budget. Most content functions have one number covering both, which makes it impossible to see that production got cheaper while distribution got harder. Split them and the allocation problem becomes visible immediately.
Cost the earned side properly. Feature 23 found 84% of citations come from earned media. If your budget has no line for third-party publication, you have no allocation against the largest share of the new channel.
Stop reporting pieces published. When marginal production cost falls, output volume becomes a measure of tooling rather than of effort or effect. It was always a weak metric; it is now actively misleading.
Model the two curves for your own operation. What did a published piece cost you two years ago and what did it return? What does it cost now and what does it return now? Both numbers are available internally. The ratio between them tells you whether more or less is the right answer, and it is your ratio rather than the industry's.
| Measure | Value | Grade |
|---|---|---|
| Investment | ||
| Content share of total marketing spend | 26% | Reported |
| B2B marketers increasing content spend | 61% | Stated intent |
| Increasing AI tooling investment | 45% | Stated intent |
| Increasing owned media investment | 32% | Stated intent |
| Increasing paid media investment | 25% | Stated intent |
| Digital share of B2B marketing budget | 61% | Reported |
| Delivery | ||
| Google traffic to publishers, global | −33% | Reported - Feature 21 |
| AI Overview citations from top-10 rankers | 38% | Reported - Feature 22 |
| AI citations from earned media | 84% | Reported - Feature 23 |
| Not established | ||
| Content budget growth decomposed by intent | - | Not surveyed |
| Change in return per published piece | - | No research located |
How we did this
What this doesn't prove
- That content budgets are misallocated. We set out three readings and decline to choose. The data does not support choosing.
- That the two figures in Figure 01 describe the same organisations. Publisher traffic and B2B content budgets are different populations. The juxtaposition is directional.
- Which force in Figure 03 dominates. That is the central question and it is unanswerable at industry level with available data.
- That stated investment intent becomes actual spend. It frequently does not, and no follow-up data exists.
- Any figure for return per published piece. This is the number that would settle the argument and no research we found produces it.
- That the 26% is comparable year over year. We have one year's figure. Without the prior year we cannot say whether the share rose, and coverage describes it as risen without publishing the baseline.
Sources for this feature
- Content marketing budget, spend and investment-intent data, 2026. thedigitalelevator.com, digitalapplied.com, sqmagazine.co.uk From a company that sells into this market - compiled statistics, interested publishers
- Features 16, 21, 22, 23 and 26 of this edition. Another feature in this edition