
There is a habit in paid media of reading a spend increase as a health signal. Spend went up, therefore the channel is working, therefore do more of it. It is a comfortable reading and it is frequently wrong, because a spend number is a product of two independent variables and it does not tell you which one moved.
Spend is volume multiplied by price. If spend rises 20% because you bought 20% more impressions at the same CPM, that is a scale story - you found more of something that was already working. If spend rises 20% because the same impressions cost 20% more, that is a margin story, and it is a different conversation with a different set of decisions attached.
Q1 2026 is an unusually clean quarter for making this distinction, because the data separates cleanly. Working from Tinuiti's Q1 2026 Digital Ads Benchmark Report - a sample of their own advertiser base, not a market census - we decomposed reported spend growth into its volume and price components across twelve channels.1
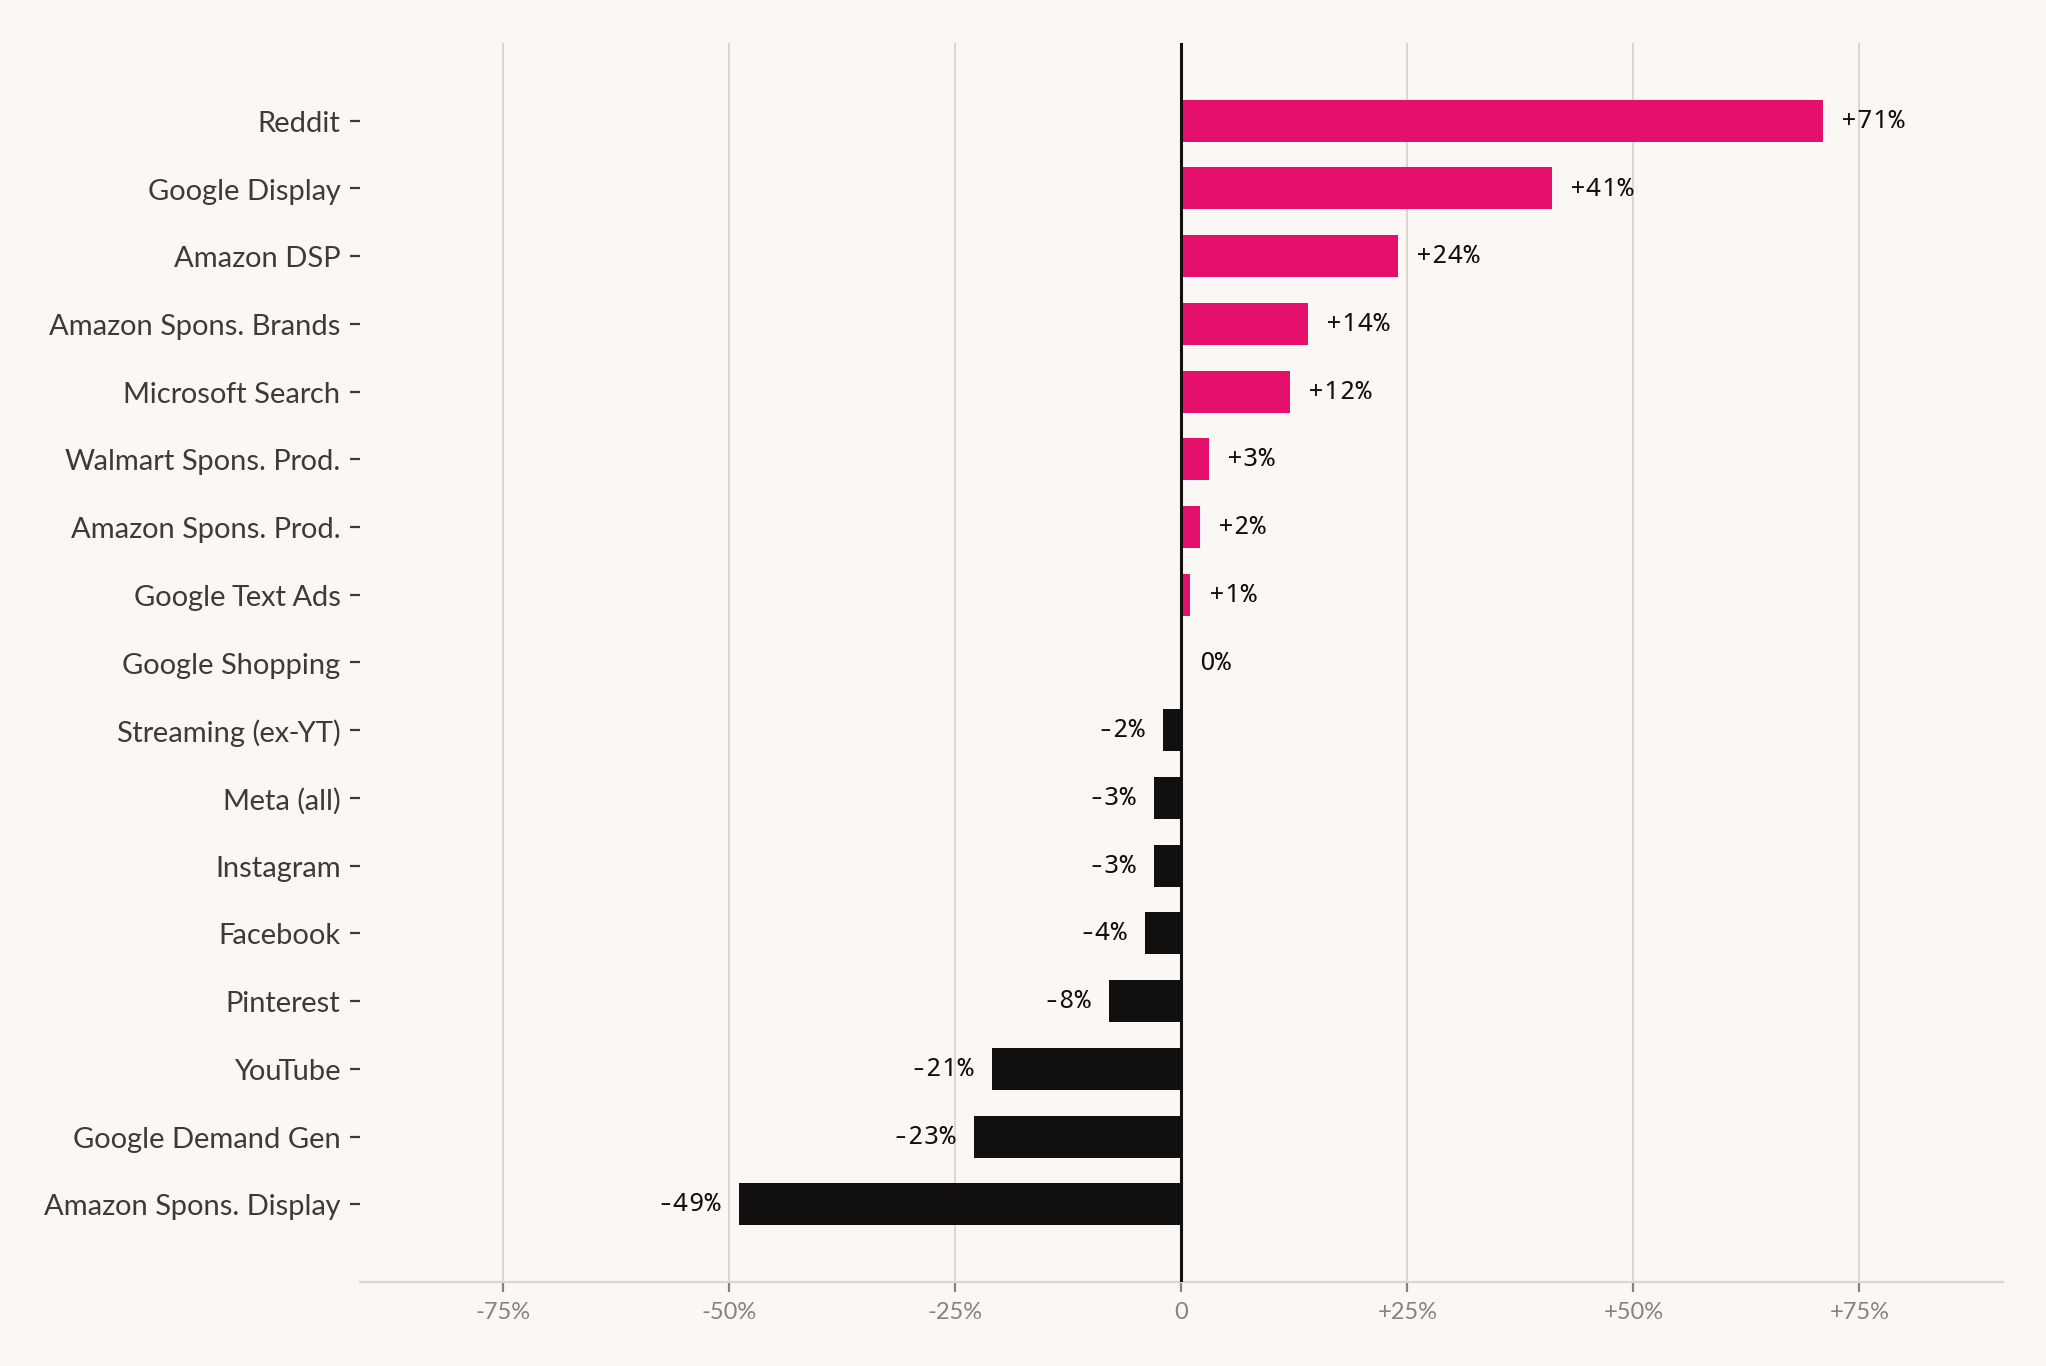
Nine of twelve channels grew on volume. Three grew on price. The three price-led channels are the ones worth a planning meeting.
What the decomposition shows
The pattern across the large channels is consistent enough to be boring. Google paid search spend rose 14% year over year with average CPC flat, on click growth of 14% - the strongest click growth in nearly two years. Google Shopping rose 18% on 18% click growth with flat CPCs. Meta-owned platforms grew spend 13% while CPM fell 3% and impressions rose 17%.
YouTube is the most extreme case in the set. Spend grew 20%. Impressions grew 52%. CPM fell 21%. Almost none of YouTube's spend growth was price - advertisers bought dramatically more inventory at a materially lower unit cost, largely because the inventory moved to television screens, which took 72% of video campaign spend in the quarter.
Google Demand Gen tells the same story more sharply still: 22% spend growth against 59% impression growth and a 23% CPM decline.
The volume story, and why it is not simply good news
Falling unit costs against rising spend usually means one of three things: new inventory has entered the auction, demand has softened, or the mix has shifted toward cheaper placements. In Q1 2026 the evidence points overwhelmingly at the third.
Instagram is the clearest illustration. Spend grew 28%, impressions grew 31%, and CPM fell 3% - the platform's first CPM decline since 2023. The mix explanation is visible in the placement data: Reels accounted for 33% of Instagram ad impressions in Q1 2026, up from 19% a year earlier, and the highest share ever recorded in this sample. Feed, which was the dominant placement as recently as Q4 2023, has fallen to 26%.
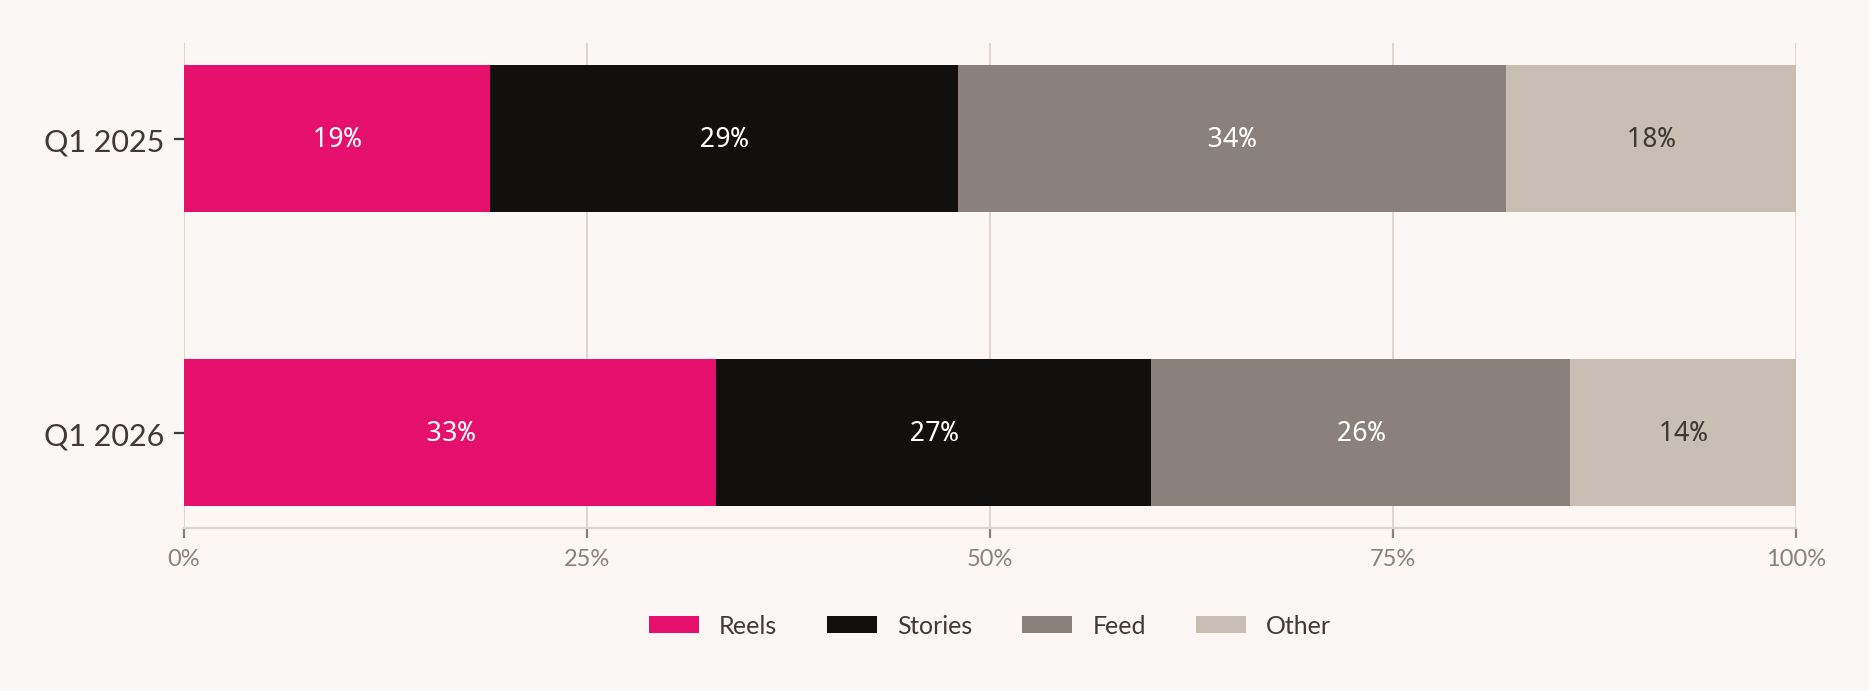
This matters operationally because a blended CPM decline driven by mix is not the same as a genuine efficiency gain. If your Reels share rose and your blended CPM fell, you have not become better at buying media. You have bought a different, cheaper thing. Whether that thing converts as well is a separate question that the CPM number cannot answer, and one that a quarterly blended metric will actively obscure.
The same caution applies to YouTube's 21% CPM decline. Television-screen inventory took 72% of video campaign spend and Shorts became the second-largest format at 18%. Both shifts move the blended average. Neither tells you whether the incremental impression was worth buying.
The test that separates the two
The question to ask of any falling blended CPM is simple: did the cost per outcome fall by a similar proportion? If CPM fell 21% and cost per acquisition fell roughly in line, the cheaper inventory is genuinely working. If CPM fell 21% and cost per acquisition is flat or worse, you have bought volume that does not convert, and the efficiency was arithmetic rather than real.
This is not a sophisticated test. It is close to the minimum standard. It is also routinely skipped, because a falling CPM reads as good news in a monthly deck and nobody asks the follow-up.
The three exceptions
Nine of twelve channels grew on volume. Three grew on price, and each for a different and instructive reason.
Reddit: price discovery, not demand
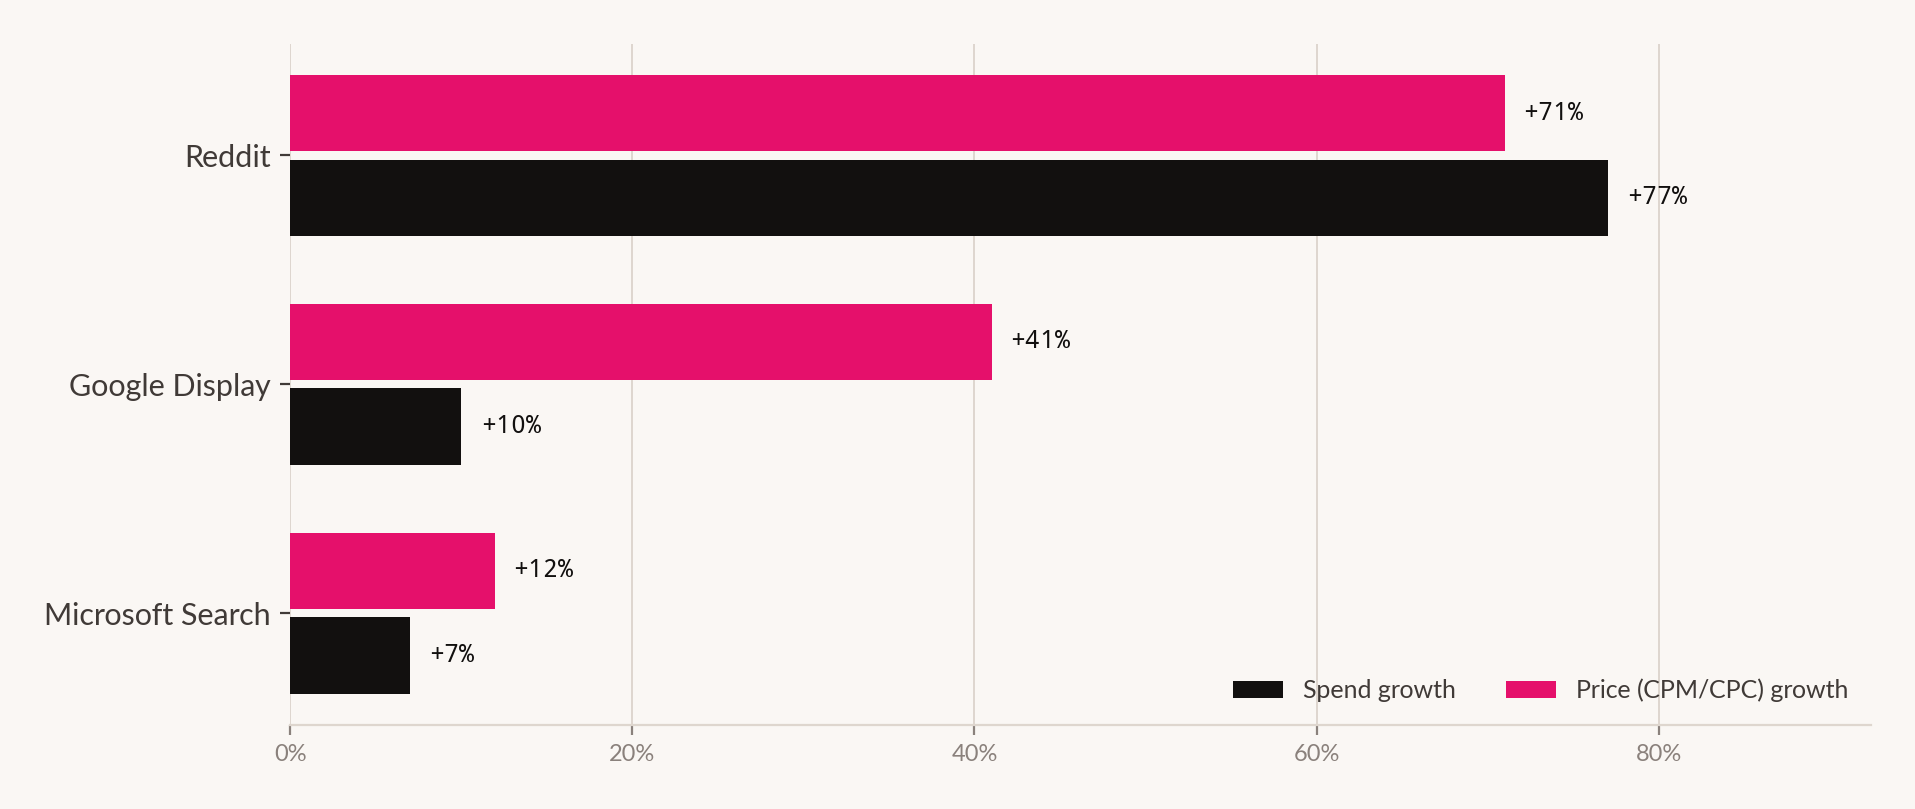
Reddit spend rose 77% year over year, driven largely by a 71% CPM increase. That is a platform repricing, not an advertiser efficiency story. Emerging channels do this - inventory that was underpriced relative to its attention gets bid up as more advertisers arrive. The operating question is whether you were early enough that your historical performance was built on prices that no longer exist.
If a channel worked at last year's CPM and CPMs are up 71%, last year's result is not a forecast. It is a record of a market that has changed.
Google Display: the one to actually worry about
Google Display Network is the most uncomfortable line in the whole dataset. Spend rose 10%. Impressions fell 22%. CPM rose 41%.
Advertisers paid more, in total, for materially less inventory. Set against YouTube in the same quarter - 20% more spend for 52% more impressions at 21% lower CPM - the contrast is stark, and both channels sit inside the same ad ecosystem.
There are benign explanations. A mix shift toward higher-quality placements would raise CPM and reduce impression volume simultaneously, and that would be a deliberate, defensible choice. But it should be a choice someone made, and it is worth confirming that it was, because the same pattern is what budget drifting into an underperforming channel looks like from the outside.
Microsoft: the Amazon effect running in reverse
Microsoft search spend growth slowed from 16% in Q4 2025 to 7% in Q1 2026. CPC growth accelerated from 5% to 12%. Clicks went from +10% to −5%.
Fewer clicks, each costing more. The most likely driver is competitive: Amazon's shift toward Microsoft Shopping adds a large, well-funded bidder to a smaller auction, and small auctions reprice faster than large ones when a major participant enters.
Google, meanwhile, held CPCs flat while growing clicks 14% - and Tinuiti attributes part of that stability to Amazon's reduced presence in Google's auctions. The same advertiser moving between two auctions produced opposite pressure in each. That is a useful reminder that auction prices are not a market-wide weather system; they are the aggregate of who happens to be bidding next to you.
The automation layer, and the correction
One further pattern deserves attention because it cuts against the prevailing narrative.
Performance Max accounted for 67% of Google Shopping spend and 68% of Shopping sales in Q1, and delivered slightly better return on ad spend than standard Shopping for advertisers running both. That is a straightforward endorsement of the automated product on the search side.
On the Meta side, the movement went the other way. Advantage+ Sales Campaigns fell to 20% of retail spend, down from a 38% peak a year earlier. Advertisers withdrew roughly half their allocation from Meta's most automated buying product within twelve months.
Two automated products, two opposite trajectories, in the same quarter. The lazy conclusion - automation is winning, or automation is failing - fits neither. The more useful reading is that automation is being evaluated on results rather than adopted on principle, and that a product's automation level is not what determines whether operators keep using it.
| Channel | Spend | Volume | Price | Growth driver |
|---|---|---|---|---|
| Search | ||||
| Google paid search (total) | +14% | +14% | 0% | Volume |
| Google text ads | +13% | +11% | +1% | Volume |
| Google Shopping | +18% | +18% | 0% | Volume |
| Microsoft search | +7% | −5% | +12% | Price |
| Social | ||||
| Meta (all properties) | +13% | +17% | −3% | Volume |
| +4% | +8% | −4% | Volume | |
| +28% | +31% | −3% | Volume | |
| +27% | +37% | −8% | Volume | |
| +77% | - | +71% | Price | |
| Retail media | ||||
| Amazon Sponsored Products | +21% | +19% | +2% | Volume |
| Amazon Sponsored Brands | +3% | −10% | +14% | Price |
| Amazon Sponsored Display | −34% | - | −49% | Contraction |
| Amazon DSP | +41% | +14% | +24% | Mixed |
| Walmart Sponsored Products | +62% | +57% | +3% | Volume |
| Video and display | ||||
| YouTube | +20% | +52% | −21% | Volume |
| Google Demand Gen | +22% | +59% | −23% | Volume |
| Google Display Network | +10% | −22% | +41% | Price |
| Streaming video (ex-YouTube) | +6% | +8% | −2% | Volume |
What to do with this
Three practical consequences follow, none of which require agreeing with our reading of the data.
Decompose before you report. Any spend movement presented without its volume and price components is an incomplete number. This is a reporting-template change, not an analytics project, and it takes one afternoon.
Treat blended CPM declines as a question, not a result. Where a blended unit cost has fallen, establish whether the cost per outcome fell with it. If it did not, you have a mix shift being reported as an efficiency gain, and next quarter's plan will be built on it.
Re-baseline the price-led channels. On Reddit, Google Display and Microsoft search, historical performance was achieved at prices that no longer apply. Any forecast carrying last year's cost assumptions on those three channels is carrying an error you can quantify today.
How we did this
What this doesn't prove
- Nothing about conversion or return. Every figure here is a media-buying metric. A cheaper impression that does not convert is not an efficiency gain, and this dataset cannot tell you which you got.
- Nothing generalisable to your account. A single advertiser's mix, geography and category can invert any of these directions. Sample-level direction is a prompt to check your own numbers, not a substitute for them.
- Nothing causal about Amazon's auction shifts. The Microsoft and Google CPC divergence is consistent with Amazon's movement between auctions, and Tinuiti notes the connection. Consistency is not causation and no isolation test is available in public data.
- Nothing about the mix explanation for falling CPMs. We infer that placement mix drove the Instagram and YouTube CPM declines from the reported placement shares. That inference is plausible and unproven.
- Nothing about why Advantage+ share fell. The decline is reported. The cause is not, and we do not speculate on it beyond noting the divergence from Performance Max.
Sources for this feature
- Tinuiti, Digital Ads Benchmark Report, Q1 2026. tinuiti.com/research-insights/research/digital-ads-benchmark-report Straight from the source
- Tinuiti, Digital Ads Benchmark Report, Q1 2025, for prior-year placement share. tinuiti.com/research-insights/research/digital-ads-benchmark-report-q1-2025 Straight from the source
- Karooya, Digital Ads Benchmark Report by Tinuiti, Q1 2026: Key Highlights, April 2026. karooya.com A named study, reported by someone else - secondary coverage