
Assemble the desk and the individual findings resolve into one movement.
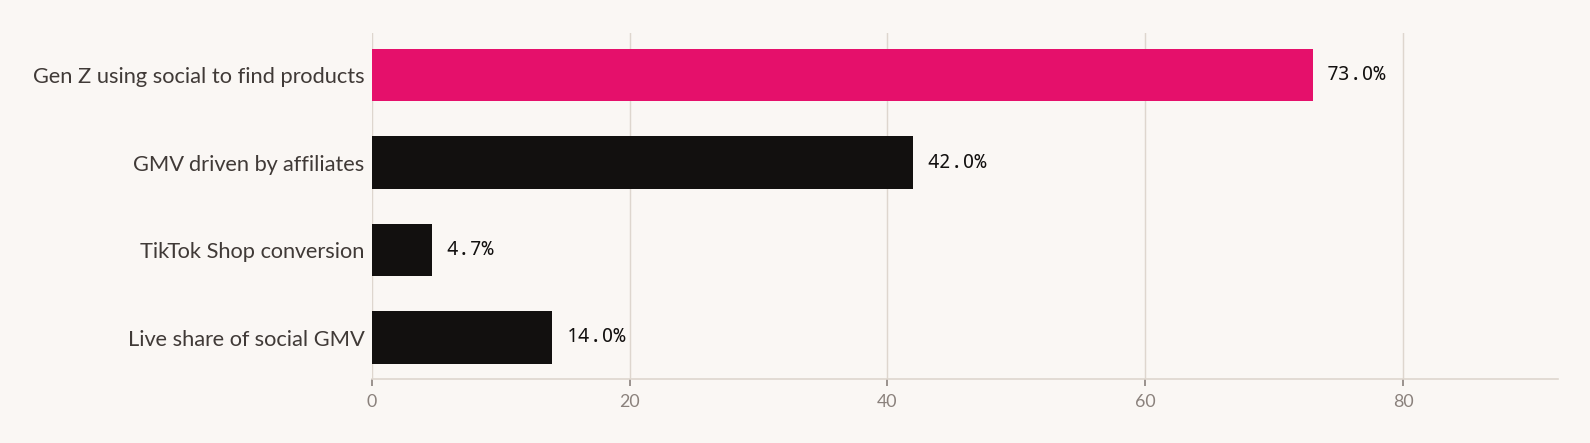
73% of US Gen Z say social is their main source for learning about new products. TikTok Shop converts at 4.7% against Facebook Shops at 1.8%. 42% of US GMV runs through affiliates drawn from a two-million-creator marketplace. Live sessions grew 340%. And a dozen governments are legislating who is allowed on it.
Each of those is usually reported as a social media story. Together they describe something else.
Discovery, transaction, payment, sales force and showroom. That is not a media channel. It is most of a company.
The trade being made
Every one of those functions arrives with the same bargain, and it is worth stating explicitly because it is usually made implicitly, one integration at a time.
The left column is why adoption is fast. The right column is why the Content desk's Feature 25 argued for owned audience, and the argument transfers here with more force: a channel that owns discovery, transaction and the customer relationship is not a channel. It is a landlord.
The regulatory finding is the structural one
Feature 39 is easy to file as policy news and it is the most strategically important thing on this desk.
Australia removed 4.7 million under-16 accounts and roughly 70% of under-16s are still accessing social media. A dozen more countries are drafting. Portugal has approved fines at 2% of global revenue.
Now set that against Feature 41. If 73% of Gen Z discovery happens on these surfaces, and access to those surfaces is becoming a matter of national legislation that differs by country, then a brand's discovery layer for its youngest customers is now subject to regulatory risk it has no influence over and cannot diversify away from inside the category.
That is a different kind of exposure from an algorithm change. An algorithm change redistributes reach. A minimum-age law removes a cohort - or, on the Australian evidence, removes the platform's ability to identify the cohort, which is arguably worse for anyone relying on age targeting.
What this desk could not establish
Four gaps, and they matter more than most of the figures above them.
Whose interest this serves
Almost every commerce figure on this desk comes from agencies, seller tools and platform partners whose businesses depend on the category growing. We could not find a source for the conversion, GMV or creator data that does not sell into it. The regulatory material in Feature 39 is the exception and comes from law firms and policy institutes. Marketing Legendary operates a social practice - and this feature's conclusion, that brands should think carefully about how much commercial architecture to place inside a platform, is the conclusion that argues for advisory work. That is us.
What to do about it
Decide which functions you are renting, deliberately and once. Discovery, transaction, sales force, customer relationship. Most companies have made this decision four separate times without noticing they made it at all.
Keep the customer relationship out of the rental agreement. The Content desk's Feature 25 makes the case: an owned list is the one channel nobody else can reprice. Every social commerce integration should have a plan for moving the buyer into a relationship you hold.
Price the concentration before it prices you. If a majority of your discovery and a plurality of your sales sit on one platform in a category with a dozen governments legislating, name the number that would trigger diversification. Deciding it now is far cheaper than deciding it after an announcement.
Get the four missing numbers for your own business. Creator earnings in your programme, revenue per live session, an attribution test against self-reported discovery, and returns-adjusted margin. All four are available internally and none is published by anyone.
Do not confuse GMV growth with your growth. $64.3bn is merchandise value across every seller on a platform. It sizes a market. It says nothing about whether your participation in it earns anything.
| Finding | Value | Feature |
|---|---|---|
| Regulation | ||
| Under-16 accounts acted on, Australia | 4.7m+ | 39 |
| Under-16s still accessing, parent-reported | ~70% | 39 |
| Formal investigations opened | 5 platforms | 39 |
| Portugal penalty ceiling | 2% of global revenue | 39 |
| Commerce | ||
| TikTok Shop conversion | 4.7% | 40 |
| Instagram Shopping / Facebook Shops | 2.1% / 1.8% | 40 |
| TikTok Shop global GMV, 2025 | $64.3bn | 40 |
| Year-over-year growth | +94% | 40 |
| Discovery | ||
| US Gen Z: social is main product source | 73% | 41 |
| Gen Z buying gifts via social vs all buyers | 42% / 20% | 41 |
| US social buyers on TikTok, 2026 | 51% | 41 |
| The selling layer | ||
| US GMV driven by affiliates | 42% | 42 |
| Creators in the marketplace | 2m+ | 42 |
| Creators at six-figure sales | 16,000+ (~0.8%) | 42 |
| Livestream session growth | +340% | 43 |
| Live share of US social commerce GMV | ~14% | 43 |
| Not established anywhere on this desk | ||
| Creator earnings, as distinct from sales | - | Commission unpublished |
| Revenue per live session, over time | - | Not published |
| Actual versus remembered discovery | - | Self-report only |
| Returns, margin, basket value | - | Not published |
How we did this
What this doesn't prove
- That the four functions are equally embedded. Discovery and transaction have hard numbers. "Showroom" and "sales force" are characterisations of what the data implies.
- That renting these functions is a mistake. The left column of the trade is genuinely valuable and hard to replicate. The argument is for deciding deliberately, not for declining.
- That any of the growth is profitable. Named as the fourth gap. No margin or returns data exists anywhere on this desk.
- That concentration will produce a shock. Regulatory risk is real and its realisation is not predicted here.
- That the desk's sources are reliable. Most sell into the category they measure. Consistency across them is not independence.
- Anything outside the US and the sixteen markets measured. Both the behavioural and commerce figures are narrowly sampled.
Sources for this feature
- Features 39, 40, 41, 42 and 43 of this desk. Another feature in this edition - all external sourcing and grading carried from those features
- Feature 25 of the Content desk, and Features 08 and 13 of the Ads desk. Another feature in this edition