
For three years the industry argument about campaign automation has been conducted as a single question: is the black box good or bad. It is the wrong shape of question, and Q1 2026 demonstrates why with unusual clarity.
Two of the largest advertising platforms sell essentially the same proposition. Hand over targeting, placement and bidding. Supply creative and a product feed. Let the system allocate. Google calls it Performance Max. Meta calls it Advantage+ Shopping Campaigns. The pitch is close to identical and the underlying machinery is comparable.
In the same quarter, advertiser behaviour toward the two products moved in opposite directions - and not marginally.
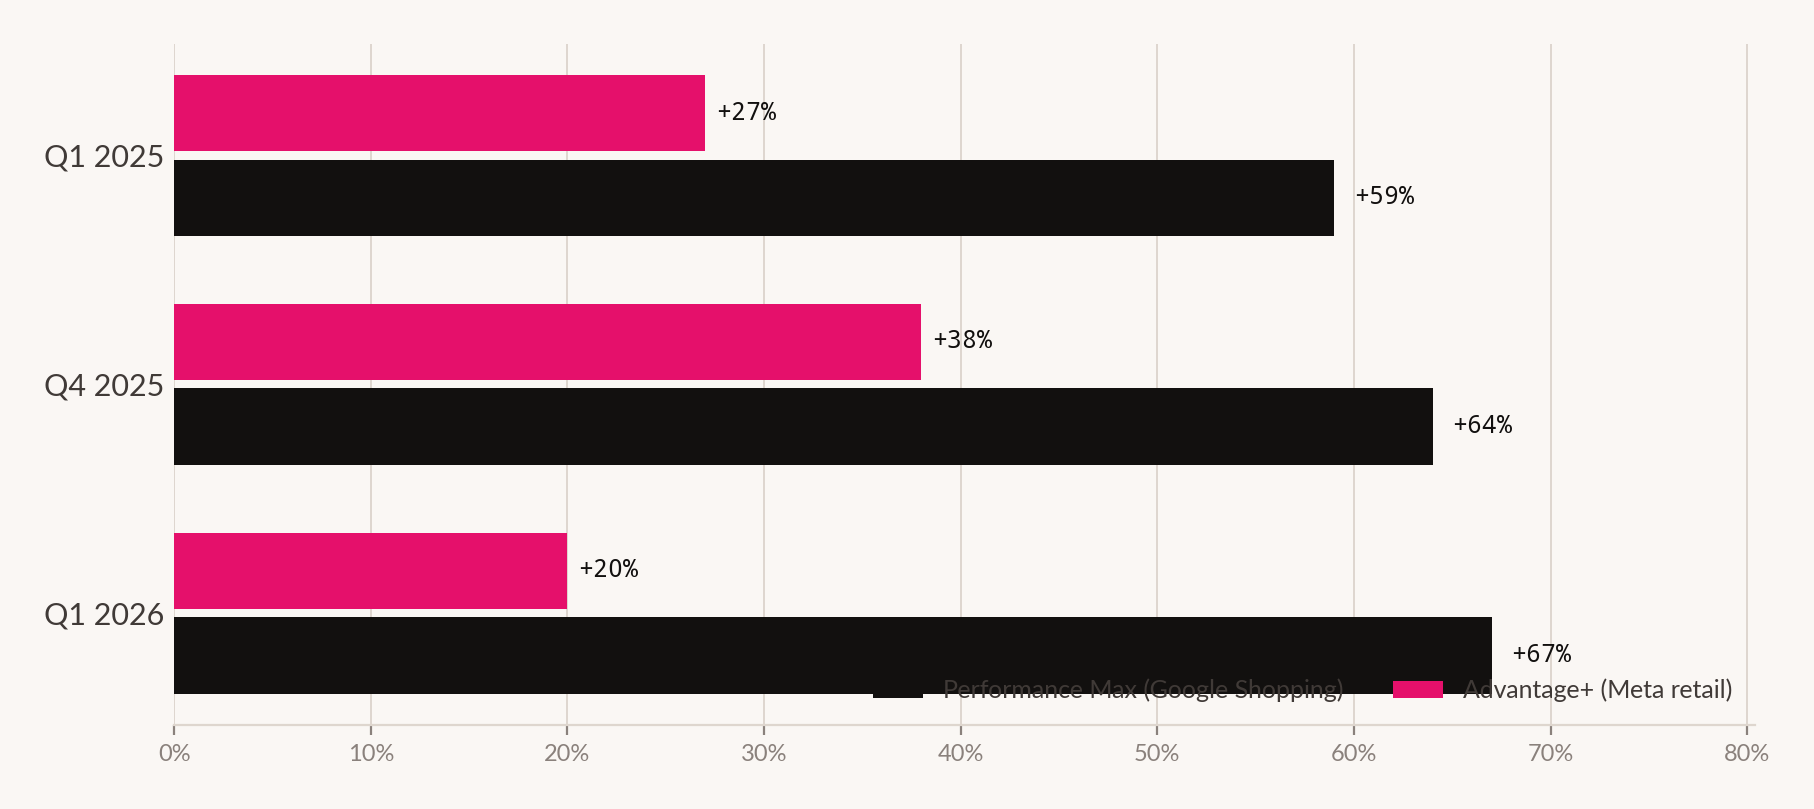
Performance Max took 67% of Google Shopping spend. Advantage+ fell to 20% of retail Meta spend, from a 38% peak twelve months earlier.
One product consolidated its position. The other lost roughly half its budget share inside a year. Any explanation resting on "advertisers are warming to automation" or "advertisers are rejecting automation" fails immediately, because both happened simultaneously to two versions of the same idea.
The divergence, quarter by quarter
The Advantage+ decline is not a single bad quarter. It is a consistent three-quarter trajectory: 38% of US retail Meta spend in Q1 2025, 27% in Q4 2025, 20% in Q1 2026.1,2
Performance Max moved the other way and then held. It accounted for 67% of Google Shopping ad spend in Q1 2026 and 68% of Shopping sales - a share slightly above its spend share, which is the first useful signal in this dataset.
What each platform's own numbers say
On Google's side the reported case is straightforward. Among advertisers running both Performance Max and Standard Shopping, Performance Max delivered slightly better return on ad spend, and its 68% share of sales against 67% of spend indicates it is not simply absorbing budget without producing proportionate revenue.
That comparison has a real virtue: it is a within-advertiser comparison. The same brands, in the same quarter, running both campaign types, with PMax coming out marginally ahead. It is not a controlled experiment, but it is considerably better than comparing adopters to non-adopters.
On Meta's side the reported case is, on its face, stronger still. Agency-reported figures put Advantage+ Shopping at roughly 4.5× ROAS against 3.7× for manually configured campaigns - a lift in the 15–25% range, with materially lower cost per acquisition across ecommerce verticals.3
Which produces the puzzle. If Advantage+ reports a 20%-ish ROAS advantage, why did advertisers cut its share of their budgets by nearly half in a year?
The evidence that resolves it
The most useful counterweight comes from incrementality testing rather than platform reporting. Haus ran 640 incrementality tests over eighteen months across mid-market and enterprise brands averaging roughly $1M per month in Meta spend.4
The result inverts the reported picture. Advantage+ Shopping outperformed manual campaigns in 42% of head-to-heads. Manual won 58%.
This is the same gap that Feature 01 of this edition described in a different context: the number the platform reports and the number the business recognises are measuring different things, and they can point in opposite directions without either being fabricated.
Why attributed ROAS flatters automated campaigns structurally
The mechanism is not mysterious, and it is not evidence of bad faith by the platforms. Broad automated campaigns are given permission to buy across the full funnel, including audiences that were already going to convert - existing customers, recent site visitors, branded searchers. Those conversions are cheap to win and they are attributed to the campaign that touched them last.
A manual campaign structure that deliberately excludes those audiences will report a worse ROAS while potentially producing more incremental revenue. It is being penalised in the report for the discipline that makes it valuable.
Incrementality testing exists precisely to separate these. When the test disagrees with the report, the test is measuring the thing the business cares about.
Why the two products diverged
If the attributed-versus-incremental gap applies to automation generally, why did Performance Max hold its share while Advantage+ lost half of its?
Three structural differences are visible in the data, and we can support two of them.
1. The comparison set is not the same
Performance Max's competitor inside Google Shopping is Standard Shopping - itself a feed-driven, largely automated format with limited manual levers. The gap in operator control between the two is narrow.
Advantage+'s competitor on Meta is a manual campaign structure with genuine control over audience exclusions, placement, budget splits and creative-to-audience mapping. The gap in control is wide. An advertiser moving from Standard Shopping to PMax gives up little. An advertiser moving from manual Meta to Advantage+ gives up a great deal - including the ability to exclude existing customers, which is exactly the lever that separates attributed from incremental performance.
2. Google's auction got cheaper. Meta's advertisers got tested
Q1 2026 was a benign quarter for Google search economics. Paid search CPCs were flat while clicks grew 14%, and Shopping CPCs were flat on 18% click growth. When unit costs are not rising, the cost of leaving a campaign type alone is low, and the incentive to audit it is weak.
Meta's advertisers, by contrast, are the population where incrementality testing has spread fastest - driven by the post-ATT measurement gap and by the arrival of affordable geo-test tooling. The Haus sample is instructive here: brands averaging around $1M a month in Meta spend are precisely the cohort that can afford to run 640 tests and act on the results.
Advantage+ did not lose share because automation stopped working. It lost share in the segment that acquired the ability to check.
3. The prospecting problem
The third difference is the one we can least evidence and flag accordingly. New-customer acquisition economics are where automated Meta campaigns are most frequently reported to underperform, because the system optimises toward conversion probability and existing customers are the highest-probability converters available.
We have no dataset that isolates this cleanly, and we are not asserting it. We note it because it is the mechanism most consistent with both the incrementality result and the direction of advertiser behaviour, and because it is testable in any individual account within a quarter.
The two products, side by side
| Performance Max | Advantage+ Shopping | |
|---|---|---|
| Share of relevant spend | 67% of Google Shopping | 20% of US retail Meta |
| Direction, 12 months | Held / consolidated | 38% → 27% → 20% |
| Share of sales | 68% - above spend share | Not separately reported |
| Platform-reported performance | Slightly better ROAS than Standard Shopping, within-advertiser | ~4.5× vs ~3.7× manual (agency-reported) |
| Incrementality-tested performance | No comparable public test set | Won 42% of 640 head-to-heads |
| What the alternative offers | Standard Shopping - also largely automated | Manual - full audience exclusion control |
| Control surrendered | Narrow gap | Wide gap |
| Auction pressure, Q1 2026 | CPCs flat | CPM −3% |
What this means operationally
Automation share is not a strategy signal. The fact that 67% of Shopping spend runs through Performance Max tells you what the market does, not what your account should do. Herd data is a prompt to test, never a substitute for testing.
The control you give up matters more than the automation you gain. The clearest difference between these two products is not sophistication - it is what the advertiser can still exclude. Where an automated product removes your ability to exclude existing customers, expect reported performance to improve and incremental performance to deteriorate, and plan the measurement accordingly.
If you cannot test, weight the reported number down. Not to zero. Platform-attributed ROAS is a real measurement of a real thing; it is simply measuring last touch across a funnel the campaign was permitted to buy across. Where no incrementality capability exists, the honest position is that automated campaign performance is unresolved, rather than good.
Re-run the decision annually, not once. Advantage+ share fell across three consecutive quarters. Advertisers who evaluated it in Q1 2025 and never revisited are running a conclusion drawn in a different auction, at different creative volumes, with different measurement tooling available.
The test worth running this quarter
For any advertiser with meaningful Meta spend, one design settles the local version of this question: run the automated campaign with existing-customer exclusions applied, against the same campaign without them, and measure on incremental new-customer acquisition rather than blended ROAS. If reported ROAS falls while incremental new customers rise, the exclusion was doing work that the report was punishing.
That test is not free, but it is cheaper than a year of budget allocated on a number that was measuring the wrong thing.
How we did this
What this doesn't prove
- That Performance Max is better than Advantage+. No public test set compares them, and they operate on different platforms against different alternatives. Nothing here supports a cross-platform ranking.
- That automation underperforms. Manual won 58% of the Haus head-to-heads, which means automation won 42%. That is a meaningful minority, not a rout, and account-level factors likely determine which side a given brand lands on.
- Why Advantage+ share fell. The decline is reported and consistent. Our incrementality explanation is the most plausible mechanism we can evidence, but no source states the cause, and creative fatigue, setup quality and conversion-volume thresholds are all cited elsewhere as contributing factors.
- Anything about the prospecting mechanism. Section three of the divergence analysis is explicitly flagged as unevidenced. It is a hypothesis worth testing in-account, not a finding.
- Anything for advertisers below roughly $1M/month on Meta. The incrementality sample sits well above most accounts. Smaller advertisers face different conversion-volume constraints that plausibly change the answer.
Sources for this feature
- Tinuiti, Digital Ads Benchmark Report, Q1 2026. tinuiti.com Straight from the source
- Tinuiti, Digital Ads Benchmark Report, Q1 2025. tinuiti.com Straight from the source
- Agency-reported Advantage+ ROAS comparisons, as summarised across practitioner coverage, 2026. From a company that sells into this market - vendor-adjacent
- Haus, incrementality test programme - 640 tests, 18 months, reported via secondary coverage, 2026. A named study, reported by someone else - named study, methodology unreviewed
- Karooya, Digital Ads Benchmark Report by Tinuiti, Q1 2026: Key Highlights. karooya.com Secondary