
The headline figure is a claim about primacy, not participation, and that is what makes it consequential.
73% of US Gen Z say social media is their main source for learning about new products.1 Not one of several. The main one.
Around it: 79% of Gen Z and Millennials integrate social media into their shopping journey, and Gen Z are 42% likely to buy holiday gifts through social media against a 20% overall average.1
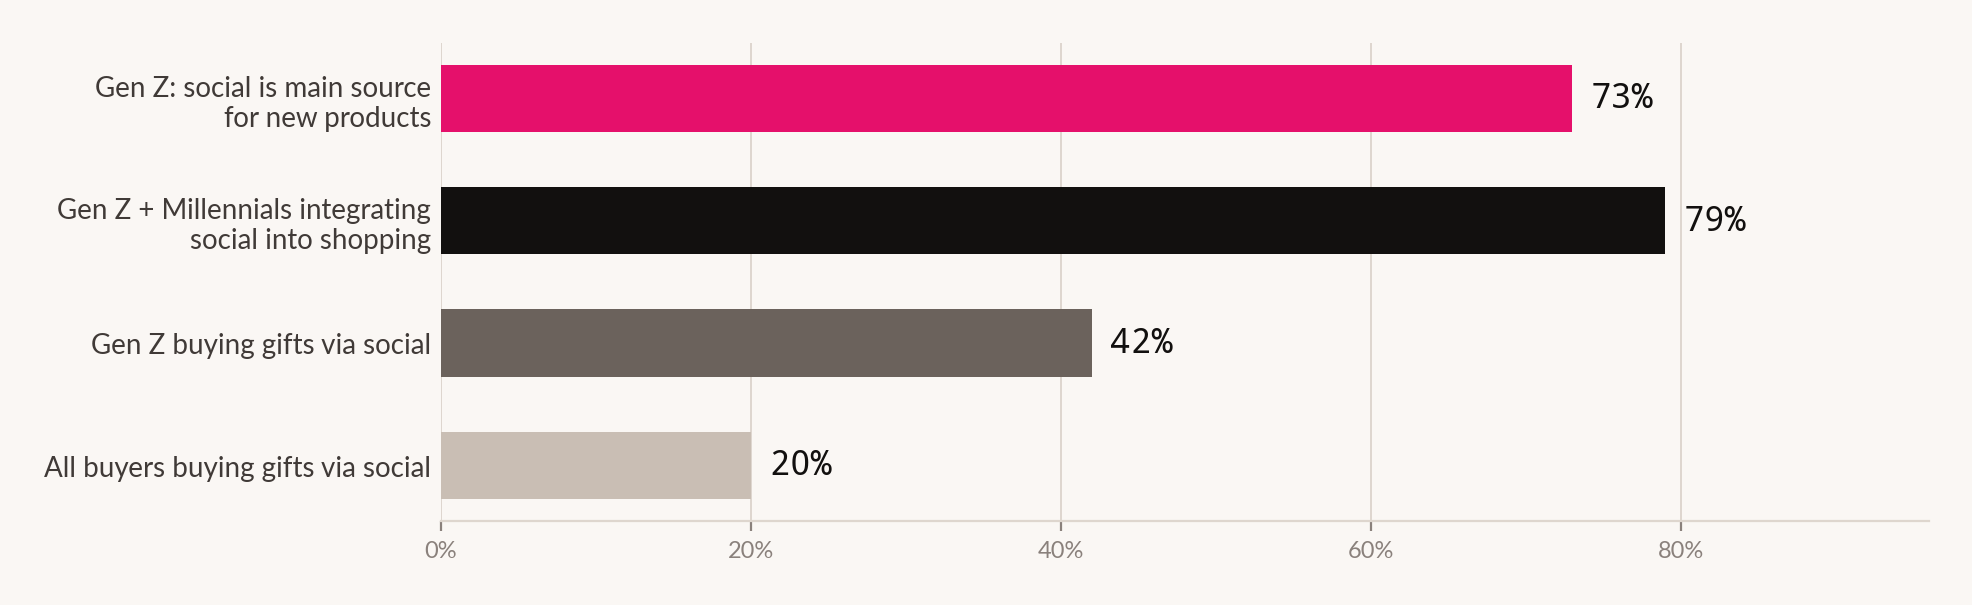
The 42% against 20% is the one to hold. Gen Z are twice as likely as the average buyer to complete a purchase inside the same surface where they discovered it.
What "main source" displaces
A discovery channel becoming primary means something else stopped being primary. Two other desks in this edition describe what.
The Content desk's Feature 21 documents Google search traffic to publishers falling 33% globally and 38% in the US, with roughly 60% of searches ending without a click, rising to 77% on mobile. Feature 22 documents ranking and citation decoupling.
Those are usually read as a search story. Set beside this figure they read differently: the discovery layer did not disappear, it relocated - partly into generated answers, and partly onto surfaces where the answer arrives without anyone having asked a question.
The consequence for measurement is awkward and largely unacknowledged. A discovery event with no query leaves no trace in any keyword-based system. An organisation whose demand-generation reporting is built on search volume is measuring the channel that serves demand and not the one increasingly creating it.
Concentration, and what it costs
The behaviour is also consolidating onto fewer surfaces. Over half - 51% - of US social buyers will shop on TikTok in 2026, crossing the threshold where a single platform represents the majority of social buyers.1
That is a real efficiency for anyone selling: one integration, one creator marketplace, one set of formats reaching the majority. It is also a concentration risk of a specific kind, and Feature 39 of this desk sets out why it is not hypothetical.
A regulatory cascade is underway across more than a dozen countries. A platform holding the majority of a generation's product discovery, in a category subject to active legislation on minimum age, is a single point of failure for any brand whose audience skews young.
The limitation worth stating plainly
Every figure in this feature is self-reported, and self-report is weak evidence for discovery specifically.
People are poor witnesses to how they came to want things. A buyer who saw a product three times on social, once in a friend's hand and once in a search result will often attribute the decision to whichever they remember most vividly - and vivid is exactly what a video is designed to be.
So 73% is a reliable measure of where Gen Z believe they discover products, and a weaker measure of where discovery actually occurs. The direction is almost certainly right. The magnitude is probably overstated, and we found no attribution study that would let us say by how much.
Whose interest this serves
These figures come from social commerce research published by agencies, platform partners and seller tools. A finding that social is the primary discovery channel is directly useful to everyone who produced it. The figures are also broadly consistent across independent compilations, which is worth something - but consistency among parties with the same interest is not independence. Marketing Legendary operates a social practice and benefits from the same conclusion.
What this does to the brief
There is an operational consequence that follows from the search-versus-feed distinction and lands squarely on how creative gets commissioned.
Search-led marketing produces content that answers. Someone has asked a question, and the job is to satisfy it better than eleven alternatives. That shapes everything downstream - the format, the structure, the comprehensiveness, the fact that it must be findable by someone actively looking.
Feed-led marketing produces content that interrupts. Nobody asked. The job is to be interesting enough that a person who was not looking for you stops, and then to make the thing available while they are still stopped.
These require different work, different skills and different measurement, and most organisations brief them from the same document.
Feature 13 of the Ads desk found what consumers actually respond to in the second category: warmth, entertainment, emotional payoff and craft - properties of the idea rather than of the optimisation. That finding sits awkwardly with a content function organised entirely around keyword coverage, and the 73% figure is the reason it can no longer be ignored.
What to do about it
Stop reporting discovery through query volume alone. If a growing share of discovery involves no query, a search-shaped measurement system will report a shrinking market that is not shrinking.
Separate demand capture from demand creation in your plan. They now run on different surfaces with different mechanics and different measurement. Most budgets still treat them as one line called "acquisition".
Do not generalise Gen Z figures to your buyer. The 42% versus 20% gap is the whole point - Gen Z behave very differently from the average, and a brand whose buyers are 45 should not plan against a 73%.
Price the concentration risk explicitly. If a majority of your social discovery sits on one platform in a regulated category, name what happens if that platform's availability changes. Feature 39 documents twelve-plus countries legislating.
Run one attribution study rather than citing survey figures. Self-report tells you what buyers remember. A holdout or geo test tells you what actually moved, and it is the only way to size this for your own business.
| Measure | Value | Grade |
|---|---|---|
| Discovery | ||
| US Gen Z: social is main source for new products | 73% | Self-reported |
| Gen Z + Millennials integrating social into shopping | 79% | Self-reported |
| Purchase | ||
| Gen Z buying gifts via social | 42% | Self-reported |
| All buyers, same measure | 20% | Self-reported |
| Gen Z multiple of average | 2.1× | Our arithmetic |
| Concentration | ||
| US social buyers shopping on TikTok, 2026 | 51% | Projection |
| Context from other desks | ||
| Google traffic to publishers, global | −33% | Content F21 |
| Zero-click searches, mobile | 77% | Content F21 |
| Not established | ||
| Actual versus perceived discovery source | - | No attribution study located |
| Whether the figures share a sample | - | Different studies |
How we did this
What this doesn't prove
- Where discovery actually happens. Self-report measures belief. No attribution study we found tests it against behaviour.
- That social displaced search. The two are complements for most categories. Both trends are real and the causal relationship is not established.
- That the figures describe one population. Gen Z alone and Gen Z plus Millennials are different groups, from different studies.
- That 51% concentration persists. It is a projection, in a category under active regulatory pressure.
- Anything about older buyers. The 42% versus 20% gap establishes that Gen Z are atypical, which limits how far any of this generalises.
- Anything outside the US. Every figure here is US-sampled.
Sources for this feature
- Gen Z social discovery and shopping behaviour, 2026. ringly.io, sqmagazine.co.uk, postplanify.com From a company that sells into this market - agency and platform-partner compilations
- Features 21 and 22 of the Content desk, and Feature 39 of this desk. Another feature in this edition