
The standard retail media narrative has been a growth narrative. Category expanding, networks proliferating, budgets shifting from trade spend into measurable media. Every grocer, pharmacy and hardware chain launching a network. A rising tide.
The Q1 2026 data supports the growth part and contradicts almost everything else. US retail media ad spend is forecast at $71.09bn in 2026, roughly 18% year-over-year growth.1 That is the tide. But the distribution of that growth, and the composition of it inside the largest network, together describe a category doing something more specific than expanding.
Two things are happening at once. Retail media is concentrating at the market level, and it is changing shape at the format level. The second is the less discussed of the two and the more consequential for anyone allocating a budget.
First, the concentration
eMarketer projects that Amazon and Walmart will capture 89% of incremental US retail media spending in 2026 - approximately $9.42bn of the $10.53bn in net-new investment.1
That figure deserves to be read twice. Not 89% of the market - 89% of the growth. Every other retail media network in the United States, collectively, is competing for roughly $1.1bn of new money in a year when the category adds more than ten times that.
On total market share the concentration is starker still. Amazon is estimated at 75–77% of US retail media, with Walmart Connect at roughly 6.9%.2 Those figures come from analyst estimates rather than reported accounts and should carry a wide error bar - but no plausible correction changes the shape.
The retail media network boom produced a great many networks and very little redistribution of budget.
For an advertiser, the operational reading is unglamorous. A long-tail retail media network is not a diversification play in any meaningful sense; it is a small, separate integration with its own reporting standard, its own measurement definitions and its own minimum commitment, competing for a share of budget that the forecast says is not really moving. That can still be the right decision where a specific retailer is strategically important to a specific brand. It is rarely the right default.
Second, and more interesting: the shape is changing
Inside Amazon - which is to say, inside roughly three-quarters of the category - the composition of ad spend moved sharply in Q1 2026, and the direction is consistent across four formats.
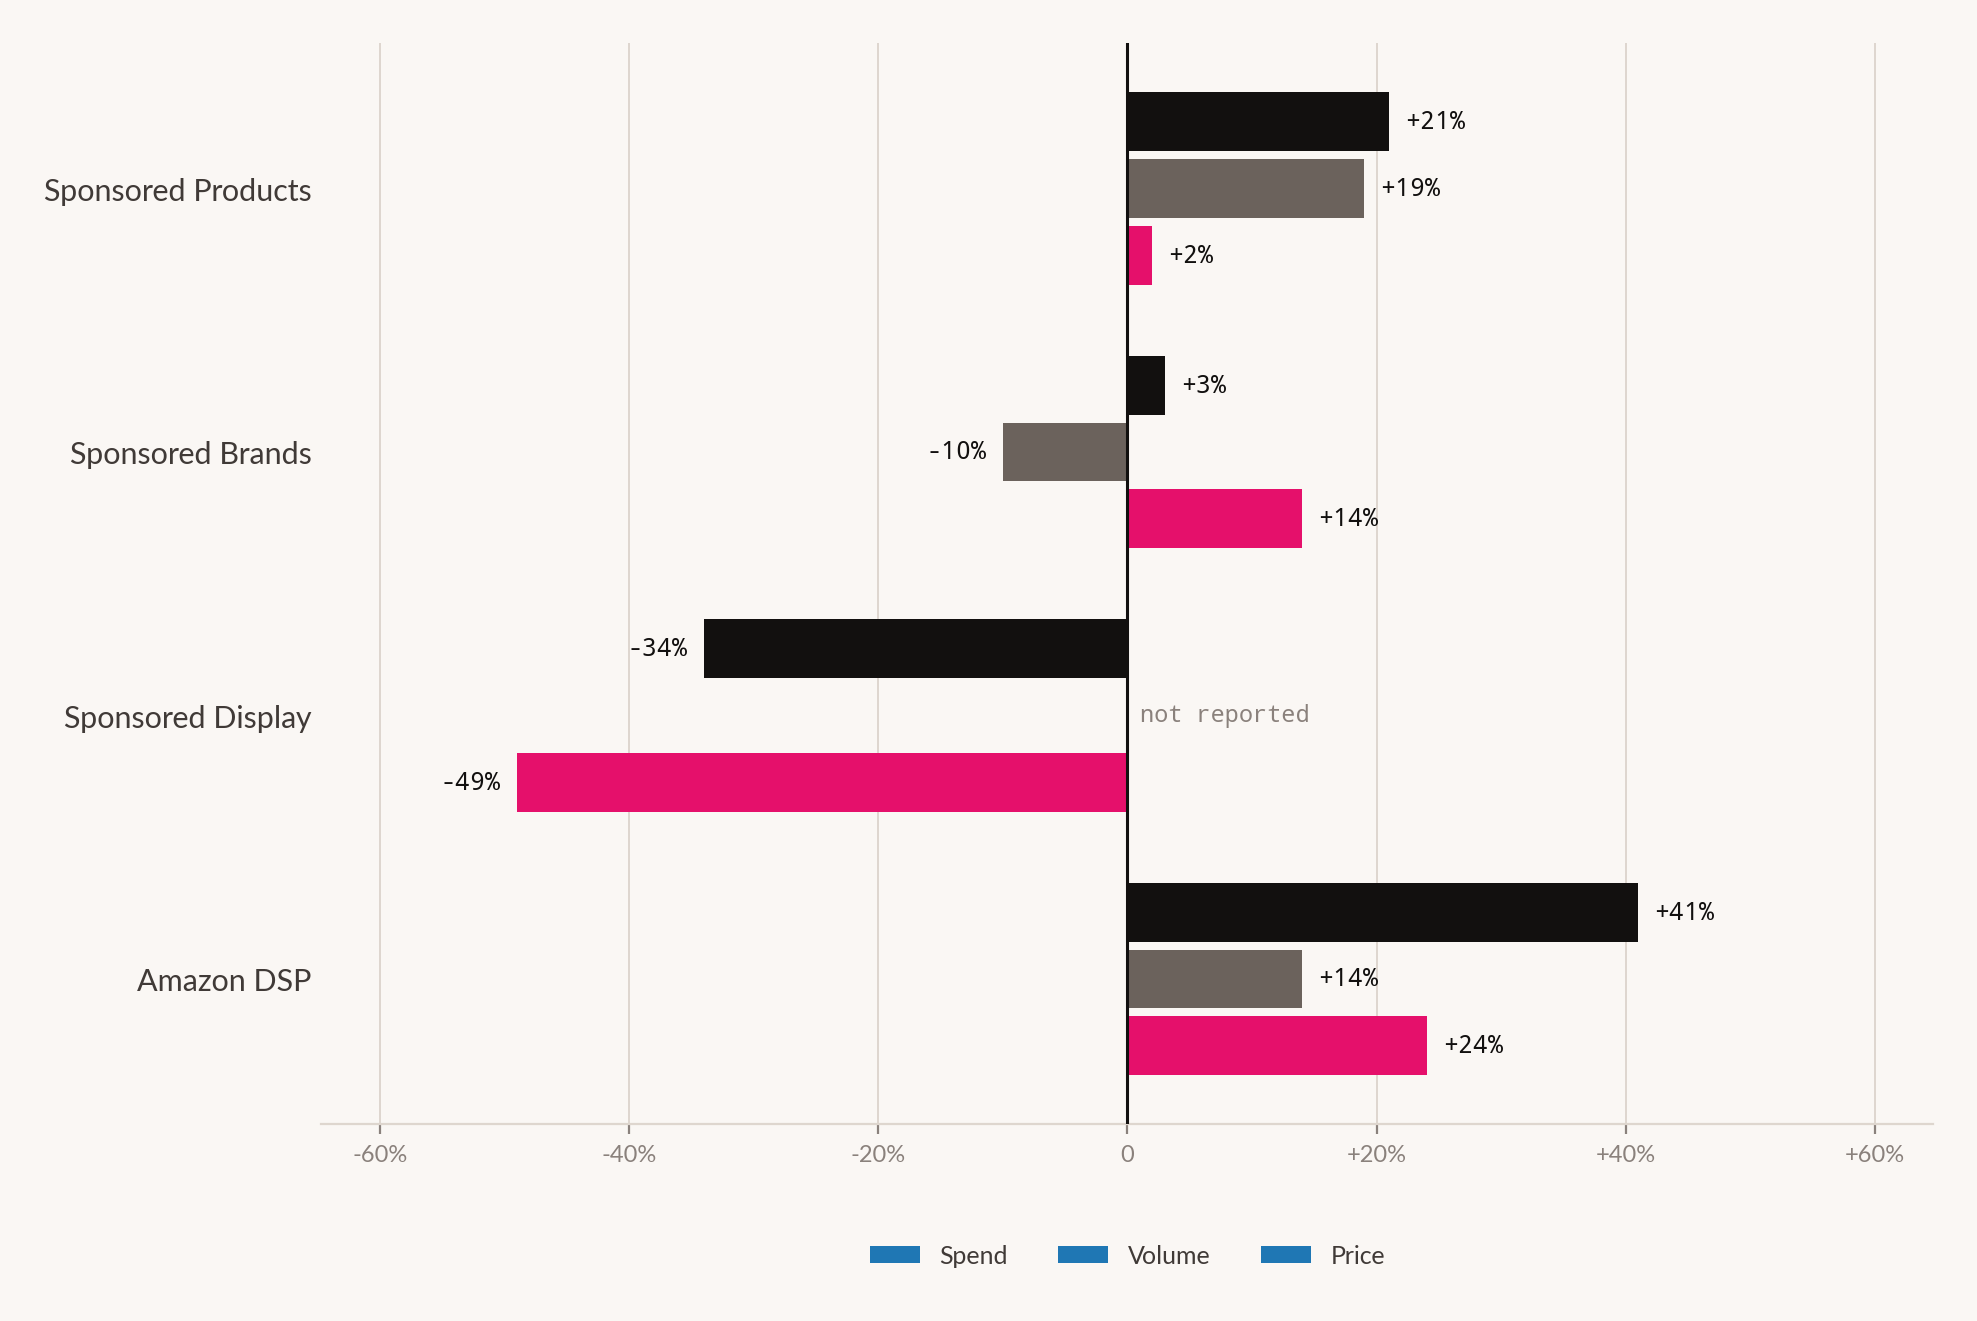
Amazon DSP grew spend 41% year over year and now accounts for 43% of total Amazon ad budgets among participating advertisers.3 Sponsored Display, the on-site display product, went the other way: spend down 34%, CPC down 49%.
Sponsored Products - the core on-site search format - remained healthy at 21% spend growth on 19% click growth and 18% sales growth, with ROAS broadly stable. Sponsored Brands stalled: 3% spend growth, clicks down 10%, CPC up 14%.
The migration is on-site to off-site
Sponsored Products, Sponsored Brands and Sponsored Display are on-site formats. They appear on Amazon, against Amazon's own shelf, at or near the moment of purchase intent. Amazon DSP is an off-site product: programmatic display and video bought across the open web and Amazon-owned properties, targeted using Amazon's shopper data.
Those are fundamentally different media buys wearing the same budget line. One is intent capture at the shelf. The other is audience buying with retail data attached - closer in mechanics to a trade desk than to a retail media network.
When 43% of an advertiser's "Amazon" budget is buying off-site programmatic inventory, the category label has become misleading. The reporting line still says retail media. The media being bought increasingly is not.
Sponsored Display: a product being abandoned
The Sponsored Display numbers deserve isolating because they are unusual. Spend fell 34%. CPC fell 49%.
Both moving down together is the signature of demand withdrawal. If a format were losing spend because it had become expensive, price would rise as spend fell. If it were losing spend to a competitor bidding the same inventory, price would hold or rise. Price collapsing alongside spend means fewer advertisers competing for the same impressions - bidders leaving the auction, not being outbid in it.
The most plausible explanation, and the one Tinuiti points to, is internal cannibalisation: advertisers increasingly favour DSP over Sponsored Display for off-site and retargeting objectives. DSP offers broader inventory, more targeting control and a more familiar programmatic operating model. Sponsored Display was the simpler on-ramp to the same job, and the on-ramp is emptying.
For anyone still running Sponsored Display at scale, that has a practical implication worth acting on rather than noting: a 49% CPC decline means the format is currently cheap. Whether cheap-and-abandoned is an opportunity or a warning depends entirely on whether the impressions still convert - which your own data can answer this quarter, and no benchmark can answer for you.
The growth engine is growing on price
There is a wrinkle in the DSP story that the headline growth number conceals, and it connects directly to the decomposition in Feature 01 of this edition.
Amazon DSP grew spend 41%. Impressions grew 14%. CPM grew 24%.
The majority of DSP's growth is price, not volume. Advertisers are not primarily buying much more DSP inventory; they are paying substantially more for a moderately larger amount of it. Against the same quarter's YouTube figures - 52% impression growth at a 21% CPM decline - the contrast in unit economics is severe.
That does not make DSP a bad buy. Rising CPMs in a growing channel are consistent with genuine demand for genuinely scarce inventory, and Amazon's shopper data is not replicable elsewhere. But it does mean the channel is repricing beneath advertisers, and any DSP plan built on last year's CPM assumptions is carrying an error that can be quantified today.
Walmart: the same curve, earlier
Walmart is the one part of the retail media market where the on-site format is still accelerating hard. Walmart Sponsored Products grew spend 62% on 57% click growth and only 3% CPC growth, producing stronger ROAS.
That is a textbook volume-led expansion: more inventory, more advertisers, prices barely moving. It is what Amazon Sponsored Products looked like at an earlier stage.
And the same structural drift is already visible. Walmart Display has reached 39% of total Walmart ad spend as advertisers expand beyond search placements. Walmart Connect grossed roughly $4.4bn in 2025, up about 27% year over year.4
Walmart, in other words, is running the Amazon playbook a few years behind: build the on-site search product, accumulate the shopper data, then move advertisers into display and off-site inventory where the inventory ceiling is higher. The 39% figure suggests that transition is already well underway rather than prospective.
| Format | Spend | Volume | Price | Reading |
|---|---|---|---|---|
| Amazon - on-site | ||||
| Sponsored Products | +21% | +19% | +2% | Healthy, volume-led |
| Sponsored Brands | +3% | −10% | +14% | Stalling, price-led |
| Sponsored Display | −34% | - | −49% | Demand withdrawal |
| Amazon - off-site | ||||
| Amazon DSP | +41% | +14% | +24% | Growth, but price-led |
| Walmart | ||||
| Sponsored Products | +62% | +57% | +3% | Strong, volume-led |
| Display (share of Walmart spend) | 39% of total | Following the same drift | ||
| Adjacent | ||||
| Amazon Prime Video | +71% | - | - | Streaming inventory scaling |
What follows from this
Stop reporting retail media as one line. On-site search and off-site programmatic have different unit economics, different price trajectories and different attribution behaviour. Reporting them together produces a blended number that describes neither. This is the single cheapest change available and it takes a reporting-template revision.
Hold DSP to programmatic standards, not retail media standards. If 43% of an Amazon budget is buying off-site inventory, it should face the questions any programmatic buy faces - incrementality, viewability, inventory quality, frequency. The retail data attached to the targeting does not exempt the buy from those questions, and a 24% CPM increase makes them more pressing rather than less.
Treat the long tail as a specific decision, not a diversification strategy. With 89% of incremental spend flowing to two networks, additional network integrations need a reason specific to your category and your retailer relationships. "Spreading risk across retail media" is not that reason, because the risk is not distributed the way the phrase implies.
Look at Sponsored Display honestly, in both directions. The format is being abandoned and is consequently cheap. That is either an arbitrage or a signal, and the only way to know which is to measure conversion on the impressions you are still buying. Do not resolve it by reference to what other advertisers are doing.
Assume Walmart repeats the pattern. If Walmart's display share is already 39% and rising, the on-site volume-led economics currently available there have a shelf life. Advertisers who benefited from Amazon's earlier phase and did not adjust when it ended have a recent, documented reason to move earlier this time.
How we did this
What this doesn't prove
- Nothing about return. Every figure here is a media-buying metric. Sponsored Display being cheap says nothing about whether its impressions convert, and DSP's CPM rise says nothing about whether the inventory is worth it.
- That the 43% DSP share applies to all Amazon advertisers. It applies to advertisers who use DSP. The share across Amazon's full advertiser base is necessarily lower and is not reported.
- Why Sponsored Display collapsed. The demand-withdrawal reading follows from spend and price falling together, which is strong but circumstantial. Cannibalisation by DSP is the explanation Tinuiti points to and the one we find most plausible; neither is a controlled finding.
- Anything about the Amazon–Walmart split of incremental spend. The 89% figure is reported jointly. We do not know how it divides and have not estimated it.
- That Walmart will follow Amazon's path. The 39% display share is consistent with that trajectory. It is a pattern, not a forecast, and Walmart's advertiser mix and inventory constraints differ.
- Anything outside the US. All market-level figures are US. Retail media concentration differs materially in Europe and Asia, where grocery-led networks hold stronger positions.
Sources for this feature
- eMarketer, Retail Media Ad Spending Forecast, H1 2026. emarketer.com A named study, reported by someone else - via secondary coverage
- Analyst estimates of US retail media market share, as circulated in trade coverage, 2026. From a company that sells into this market - unattributed
- Tinuiti, Digital Ads Benchmark Report, Q1 2026. tinuiti.com Straight from the source
- Walmart Connect 2025 revenue and growth, as reported in trade coverage. A named study, reported by someone else
- Karooya, Digital Ads Benchmark Report by Tinuiti, Q1 2026: Key Highlights. karooya.com Secondary