
There are two ways to describe India's position in artificial intelligence, and they produce opposite strategies.
The first: India has more than 100 million weekly active ChatGPT users, second only to the United States, ranks first globally by mobile monthly active users, and accounts for roughly 10% of all ChatGPT traffic.1 On volume, India is already an AI superpower.
The second: on per-capita usage, India ranks 76th of 118 countries.1
India has the volume. It does not yet have the penetration. Almost every strategic error being made about the Indian AI market comes from confusing the two.
A company reading only the first number builds for a mature, saturated market and prices accordingly. A company reading only the second treats India as early-stage and under-invests in a market already generating a tenth of global usage. The correct posture requires holding both.
The inversion nobody planned for
The fastest-moving number in the dataset is also the most consequential, and it has quietly reversed the premise on which most Indian AI products were designed.
In mid-2024, approximately 60% of ChatGPT messages from India were work-related. By late 2024, non-work usage had overtaken work usage. The current split sits at 65% non-work, 35% work - and the gap is still widening.1
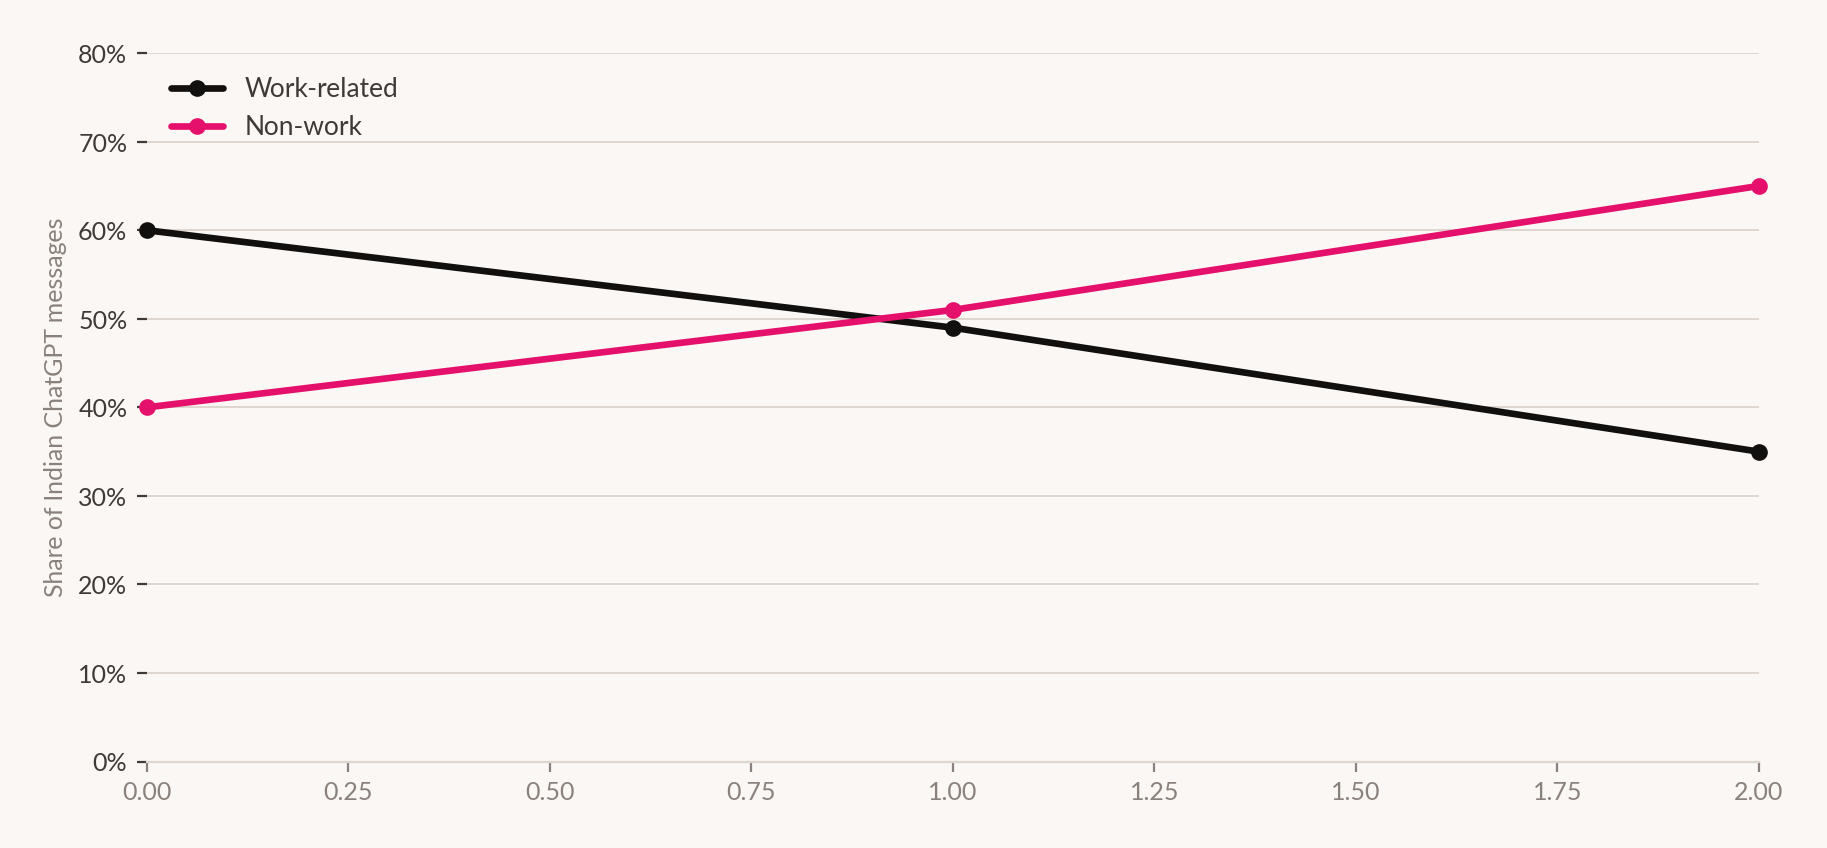
This reorders what AI in India actually is. It is not a productivity tool that occasionally helps with personal life. It is a daily-life tool that also helps with work.
The commercial consequence is direct. Products, distribution strategies and marketing built for the office buyer are optimising for the smaller half of Indian AI behaviour - and the half that is shrinking as a share.
Nearly half of that behaviour belongs to one cohort: Gen Z drives approximately 48% of India's ChatGPT messages, fifteen points above the global average. They are using AI to discover, learn and decide - which means AI has become a discovery channel in India faster and more completely than in most Western markets, and it happened outside the enterprise entirely.
Ten cities, and the rest of the country
The geographic finding is the one most likely to break an India go-to-market plan.
Half of all AI usage in India occurs in ten cities holding less than 10% of the population. That is roughly three times sharper concentration than comparable emerging markets.1
For a marketer this changes the planning unit. A national campaign in a market with this concentration profile spends most of its budget reaching people whose AI usage has not started, in order to reach the tenth of the country where it already has.
The report's own recommendation is blunt: plan at the city and state level, not the national one. India is not one AI market. It is roughly ten dense ones surrounded by a large, genuinely early market that requires a different product, a different price and a different language strategy.
And the state-level signal is not where you would guess
The two state-level datapoints in the study are worth more than their size suggests, because they contradict the metro-first assumption that usually follows a concentration finding.
Assam leads the country on education-related AI usage at 22% of messages, against a national average of around 18%. Jammu & Kashmir leads on health and wellness at 10% of messages, against roughly 7.5% nationally.1
Neither Assam nor Jammu & Kashmir appears on anybody's list of Indian technology markets. Both are leading the country on a category of AI usage that maps directly onto public service delivery.
The most plausible reading - and we mark it as a reading, not a finding - is that AI usage rises fastest where the alternative is weakest. Where formal education access or medical consultation is scarce or expensive, a free conversational tool that answers in the user's language is not a productivity upgrade. It is a substitute for a service that was not otherwise available.
If that reading holds, it inverts the standard market-entry sequence. The highest-intensity AI use cases in India may emerge furthest from the ten cities that currently generate half the volume.
The users are not casual
A per-capita ranking of 76th invites the assumption that Indian usage is shallow. The behavioural data says the opposite about the users who are active.
Indian power users ask coding questions three times more often than the global median. Data analysis usage runs at four times the global median. India ranks top five worldwide on reasoning depth.1
This is a technically sophisticated user base operating at the frontier of what the tools do - which is consistent with India ranking first globally in AI skill penetration, and with 20 of the world's top 100 AI companies having an Indian co-founder.
The gap, therefore, is not a capability gap. It is a distribution gap. The people using AI in India are using it harder than almost anyone; there are simply not yet enough of them relative to the population.
| Measure | India | Context |
|---|---|---|
| Scale | ||
| Weekly active ChatGPT users | 100M+ | #2 globally, after the US |
| Share of global ChatGPT traffic | ~10% | - |
| Mobile monthly active users | #1 | Highest in the world |
| Depth | ||
| Per-capita usage rank | 76th | Of 118 countries |
| Usage concentration | ~50% | In 10 cities holding <10% of population |
| Concentration vs peer markets | 3× | Sharper than comparable emerging markets |
| Behaviour | ||
| Non-work share of messages | 65% | Was ~40% in mid-2024 |
| Gen Z share of messages | ~48% | 15 points above global average |
| Coding questions vs global median | 3× | Power users |
| Data analysis vs global median | 4× | Power users |
| Reasoning depth | Top 5 | Worldwide |
| Talent | ||
| AI skill penetration | #1 | Globally |
| Top-100 AI companies with an Indian co-founder | 20 | Only 1 of the 20 is India-domiciled |
A discrepancy in the public numbers, stated rather than smoothed
India's ChatGPT user base is reported variously as 100 million weekly active users, over 70 million users, and as accounting for 9.79% or ~10% of ChatGPT visitors, depending on the source and the metric.
These are probably not contradictory so much as differently defined - weekly active users, monthly active users, and unique web visitors are three different populations, and none of the public sources we found states its definition with enough precision to reconcile them.
We use the Zinnov × OpenAI figure of 100M+ weekly active users because it is the most clearly labelled, and because OpenAI's participation makes it the closest thing to a first-party number available. Readers building a model on this should treat it as an order of magnitude, not a precise count.
What follows for anyone selling into India
Stop planning nationally. With half of usage in ten cities at three times peer-market concentration, a national plan is two plans wearing one budget. The dense markets need depth, pricing power and product sophistication. The rest needs distribution, language and a reason to start.
Build for the 65%, not the 35%. Non-work usage has been the majority for over a year and is still growing. Products, content and acquisition strategies aimed exclusively at the enterprise buyer are addressing a shrinking share of Indian AI behaviour - and the growing share is where habit forms.
Treat AI as a discovery channel now, not later. Gen Z generates roughly 48% of India's messages and is using AI to learn and decide. In a market where a tenth of global AI traffic is already occurring, being absent from AI answers is a distribution problem in the present tense, not a strategic consideration for 2027.
Watch the states nobody is watching. Assam on education, Jammu & Kashmir on health. If AI adoption is fastest where the alternative service is weakest, then the categories with the largest service gaps in the least-served states are where the steepest adoption curves will appear - and where almost no product is currently being built.
Price for depth, not for the average. A 76th-place per-capita ranking alongside top-five reasoning depth describes a market with a small, extremely capable core and a very large early majority. Those are two pricing problems, and a single price point will serve neither well.
How we did this
What this doesn't prove
- Anything about AI usage outside ChatGPT. The consumption picture is single-platform. In a market with heavy Android penetration, Gemini's Indian footprint could be substantial and is entirely absent here.
- That the work-to-personal inversion is permanent. Eighteen months is a short series. It could reflect a genuine behavioural shift, a change in who is being onboarded, or seasonality in enterprise usage.
- Why Assam and J&K lead their categories. Two datapoints, no mechanism stated by the source. Our service-gap explanation is plausible and untested.
- That per-capita rank is the right measure of depth. A country with extreme income inequality and 22 official languages will rank poorly per capita for reasons that have little to do with AI-specific adoption barriers.
- Any of the enterprise or infrastructure findings. The archetype survey, the compute build-out and the $1 trillion GDP argument are substantial enough to require separate treatment, and are covered in Feature 07 of this edition.
- Anything causal about the concentration figure. Ten cities generating half of usage may reflect income, connectivity, English proficiency, device mix or industry composition. The source does not decompose it and neither do we.
Sources for this feature
- Zinnov, OpenAI and Z47, The India AI Adoption Edge 2026, 13 May 2026. zinnov.com Straight from the source - primary study, co-authored by an interested party
- Public ChatGPT usage-by-country statistics, 2026, various trade compilations. From a company that sells into this market - definitions unstated, figures conflict