
Three figures, and the relationship between them is the point.
Livestream commerce sessions surged 340%. US live commerce grew 42% year over year. And live currently accounts for roughly 14% of US social commerce GMV.1
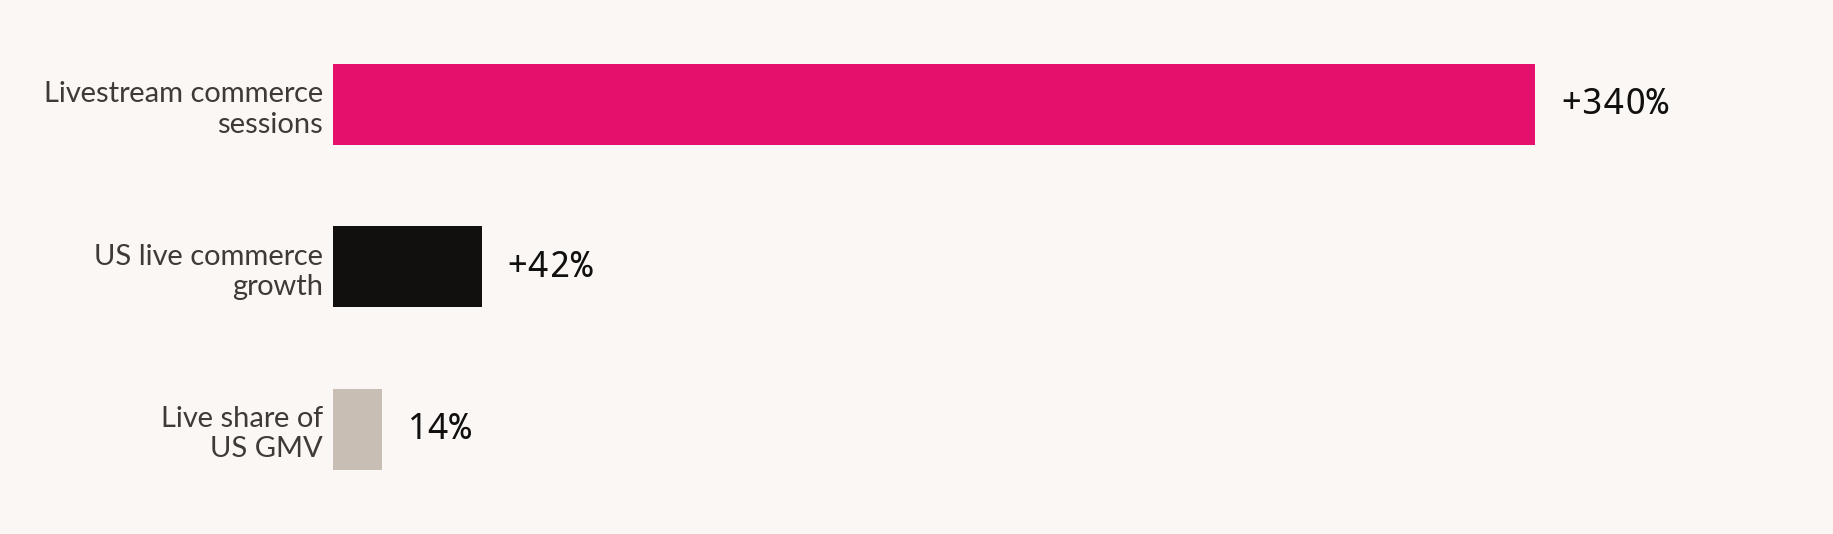
Sessions up 340%, value up 42%, share at 14%. Supply is arriving far faster than demand, which is what the early part of a format's curve looks like - and also what a bubble looks like.
The gap between 340 and 42
That divergence is the most informative thing here and it goes unremarked in the coverage.
If sessions grew 340% while the value of live commerce grew 42%, then the average session is producing substantially less than it did a year ago. Far more people are going live; the money is not keeping pace.
Two readings, and they have opposite implications.
We lean slightly toward the first reading, because the 1.2 million new merchants documented in Feature 40 would mechanically depress average session value during onboarding. But that is a lean, not a finding, and anyone building a business on live commerce should want the session-value series before committing.
Why live converts
Set aside the growth question and the format's mechanics are worth understanding on their own, because they are unusual.
Reported effects are large: live shopping drives 10 to 15 times more engagement, and brands running weekly streams see 3 to 5 times higher conversion than those relying on feed posts alone.1
Those are vendor-published multiples of exactly the kind Feature 12 of the Content desk taught us to distrust - no baseline, no sample, no definition of engagement. We report them as claims rather than findings.
The mechanism, though, is legible without the numbers. Live selling reintroduces three things that e-commerce removed:
None of these is new. All three are what a good market stall has always done, and what a decade of conversion-rate optimisation could not replicate through static pages.
Why the West lagged
Live commerce has been mature in China for years and slow everywhere else, and Feature 08 of the Ads desk explains why better than any cultural argument.
Live selling requires content and transaction on one surface. A stream that sends viewers to another site to buy loses the scarcity, the immediacy and the answered objection - the entire mechanism. Chinese platforms built commerce into content from the start. Western platforms built content first and are now retrofitting commerce, which is the same lag Feature 40 measures in the conversion spread.
The 14% share is therefore not evidence that Western consumers dislike live selling. It is evidence that the infrastructure only recently became capable of supporting it, and the 340% session growth is what happens immediately afterwards.
Whose interest this serves
The engagement and conversion multiples in this feature - 10 to 15×, 3 to 5× - are published by agencies and platform partners selling live commerce services, with no stated baseline or method. We report them as claims and grade them accordingly. The growth figures come from the same sources and carry the same interest. Marketing Legendary operates a social practice and a conclusion that live commerce is early rather than saturated is a conclusion that there is work to sell.
What to do about it
Ask for average revenue per session before you commit. It is the number that distinguishes the two readings in Figure 02, and any partner proposing a live programme should be able to produce it for comparable sellers.
Treat weekly cadence as the threshold, not the aspiration. The conversion claim attaches specifically to brands running weekly streams. An occasional stream is a different product with no evidence behind it.
Staff it for objection handling, not for presenting. The mechanism is answering questions in real time. A polished presenter who cannot answer a fit question is worse than an unpolished operator who can.
Do not run it where checkout is a handoff. Feature 40's architecture argument applies with more force here. Live selling on a surface that sends people elsewhere to buy discards the reason the format works.
Discount the multiples, keep the mechanism. 10 to 15× engagement is an unverified vendor claim. Answered objections, real scarcity and responsive demonstration are structural properties you can reason about without trusting anyone's number.
| Measure | Value | Grade |
|---|---|---|
| Growth and share | ||
| Livestream commerce session growth | +340% | Reported |
| US live commerce value growth | +42% | Reported |
| Live share of US social commerce GMV | ~14% | Reported |
| New merchants onboarded | 1.2m+ | Feature 40 |
| Claimed effects | ||
| Engagement multiple | 10–15× | Unverified, no baseline |
| Conversion multiple, weekly streamers | 3–5× | Unverified, no baseline |
| Not established | ||
| Average revenue per session, over time | - | Not published - the deciding number |
| Whether 14% is rising or plateauing | - | Single observation |
| Viewer time available to the format | - | No data |
How we did this
What this doesn't prove
- Whether live commerce is early or saturating. Both readings fit the data. The deciding series is not published.
- That the engagement and conversion multiples are real. Unverified vendor claims with no baseline. We report the mechanism instead.
- That the three mechanisms cause the conversion. They are structural properties of the format, not tested variables.
- That infrastructure explains the Western lag. It is our argument, consistent with Feature 40's conversion spread. Cultural and regulatory differences are untested alternatives.
- Whether the 340% session growth continues or reverses. Single observation, driven partly by onboarding programmes that will not repeat.
- Anything about profitability. No source reports the cost of running live commerce against what it returns.
Sources for this feature
- Live and social commerce data, 2026. shortformnation.com, shortsintel.com, digitalapplied.com From a company that sells into this market - agency and platform-partner compilations
- Features 40 and 42 of this desk, Features 08 and 13 of the Ads desk, Feature 12 of the Content desk. Another feature in this edition