
Three conversion rates, same category, same year.
TikTok Shop 4.7%. Instagram Shopping 2.1%. Facebook Shops 1.8%.1
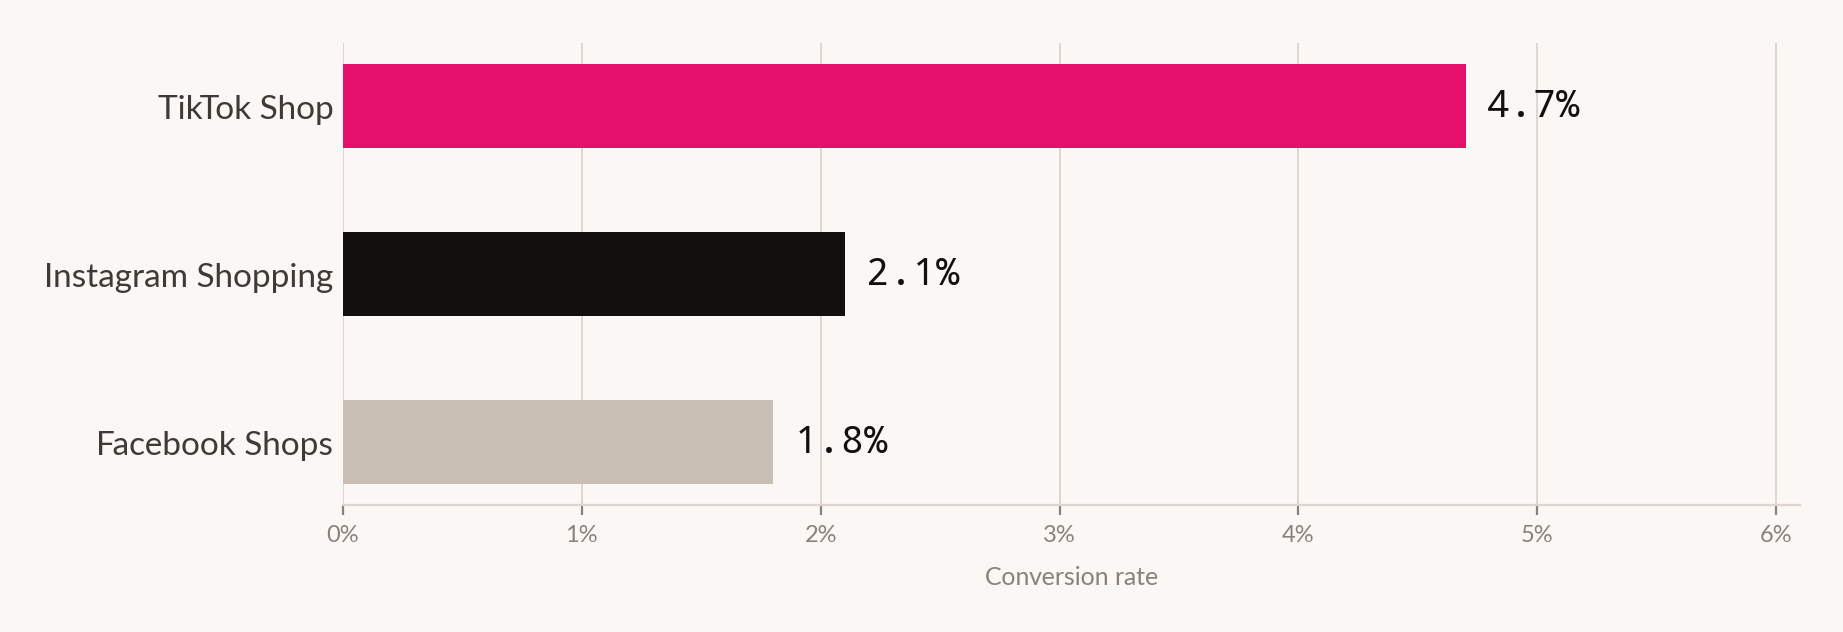
Two point six times. Not between a good advertiser and a bad one - between three platforms owned by two companies, selling comparable things to overlapping audiences.
The scale underneath
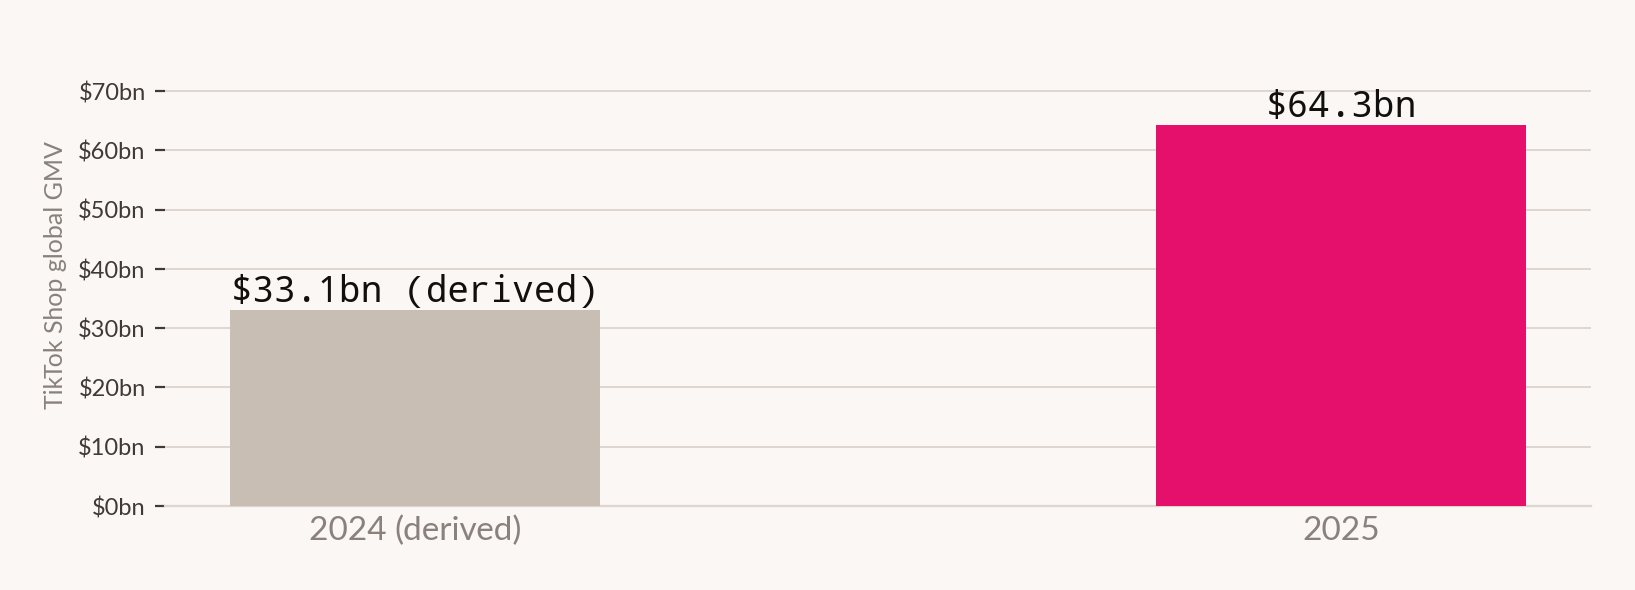
This is not a marginal category. TikTok Shop's global GMV reached $64.3bn in 2025, up 94% year over year across 16 markets.1 US GMV is projected to pass $27bn in 2026, a 200% increase, on the back of 1.2 million new merchants onboarded and a 340% surge in livestream sessions.1
Why the spread exists
The obvious explanations do not survive contact with the numbers.
It is not audience size. Instagram and Facebook have vastly larger user bases than TikTok in most of these markets, and they convert lower.
It is not creator supply. All three platforms have enormous creator populations, and many of the same creators post to all three.
It is not product category. Partly - mix differs, and we flag it as a real confounder - but not by 2.6×.
What differs is the distance between the moment of wanting and the moment of buying, measured in steps and in context switches.
The third row of each column is the one that compounds. A platform that observes the purchase can train its recommendation system on purchases. A platform that observes only the click trains on clicks - and Feature 01 of the Ads desk sets out what happens when a system optimises the event it can see rather than the outcome the business books.
This is the same structural argument Feature 08 makes about China: content and commerce built on one surface never had an attribution problem to solve. Western social platforms are now retrofitting that architecture, and the conversion data suggests the retrofit is incomplete.
What the spread does not mean
Two cautions, because the obvious conclusion is too strong.
Conversion rate is not profitability. A 4.7% conversion on low-margin impulse goods with high return rates can be worth less than 1.8% on considered purchases. None of these figures carries basket value, margin or returns, and social commerce return rates are widely reported as high without a number we could source.
Denominators are not standardised. If one platform measures conversion on product page views and another on sessions, the spread is partly definitional. We could not obtain the bases and the gap may be smaller than 2.6× on a like-for-like measure.
Whose interest this serves
Social commerce benchmark data is published almost entirely by agencies, sellers' tools and platform partners whose business depends on the category growing. Growth figures of 94% and 200%, and a favourable conversion comparison for the fastest-growing platform, are commercially useful to everyone reporting them. We could find no source for these figures that does not sell into the category. Marketing Legendary operates a social practice and benefits from the same conclusion.
What the retrofit costs the incumbents
The conversion gap is not a temporary product deficiency, and it is worth understanding why the larger platforms have not simply closed it.
A referral architecture is not a missing feature. It is a set of decisions taken years earlier - about what the feed optimises for, what the ranking system observes, where the payment relationship sits and who owns the customer record. Retrofitting native checkout means changing all four at once, on a product with billions of users and an advertising business built on the existing arrangement.
There is also a revenue conflict that rarely gets stated. A platform earning advertising revenue from sending traffic to merchants has a commercial reason to keep the transaction elsewhere. Closing the loop means competing with the merchants who currently buy its advertising, and cannibalising a mature, high-margin business to build a lower-margin one.
The platform with no advertising business to protect built commerce into the product. The platforms with one retrofitted it around the edges. The conversion data is the difference.
This is a well-documented pattern rather than a novel observation, and it suggests the gap is more durable than a feature comparison would imply. Features can be copied in a quarter. A revenue model that punishes you for copying them cannot.
What to do about it
Measure your own conversion by platform on a single definition. The published spread may be partly definitional. Yours will not be, and it is the only version that can support a budget decision.
Count the steps, not the audience. When comparing where to sell, the operative variable in this data is how many actions and context switches separate seeing from owning. Audience size has been the wrong first question for two years.
Carry basket value and returns alongside conversion. A 2.6× conversion advantage can be entirely erased by margin and return rates, and none of the published figures includes either.
Treat closed attribution as the durable advantage. Conversion gaps can close as platforms copy checkout features. A platform that observes purchases trains on purchases, and that compounds in a way a feature cannot be copied into.
Do not read GMV as revenue. $64.3bn is merchandise value across sellers, not platform revenue and certainly not yours. It sizes the opportunity, not the return.
| Measure | Value | Grade |
|---|---|---|
| Conversion | ||
| TikTok Shop | 4.7% | Reported |
| Instagram Shopping | 2.1% | Reported |
| Facebook Shops | 1.8% | Reported |
| Spread, top to bottom | 2.6× | Our arithmetic |
| Scale | ||
| TikTok Shop global GMV, 2025 | $64.3bn | Reported |
| Year-over-year growth | +94% | Reported |
| Implied 2024 GMV | ~$33.1bn | Our arithmetic |
| Markets | 16 | Reported |
| US GMV projection, 2026 | $27bn+ | Projection |
| US growth projection | +200% | Projection |
| New merchants onboarded | 1.2m+ | Reported |
| Not established | ||
| Conversion denominators | - | Not standardised |
| Basket value, margin, return rates | - | Not published |
| Product mix effect on the spread | - | Not decomposed |
How we did this
What this doesn't prove
- That architecture causes the conversion spread. It is a mechanism consistent with the data. Product mix, audience intent and category differences are untested alternatives.
- That higher conversion means better returns. No basket value, margin or return data accompanies any of these figures.
- That the conversion figures are comparable. Denominators are undisclosed and may differ by platform.
- That the growth rates persist. 94% and a projected 200% are extraordinary and typically decay.
- Anything about seller profitability. GMV growth tells you the category is expanding, not that participants are making money.
- Anything outside the 16 markets measured, or about platforms not named.
Sources for this feature
- Social commerce and TikTok Shop benchmark data, 2025–2026. digitalapplied.com, branvas.com, sqmagazine.co.uk From a company that sells into this market - agency and seller-tool compilations
- Features 01 and 08 of the Ads desk. Another feature in this edition