
Across more than 115,000 subscription apps representing over $16 billion in revenue, apps with AI features earn a 41% higher realised lifetime value per user in Year 1 than apps without them - a median of $30.16 against $21.37.1
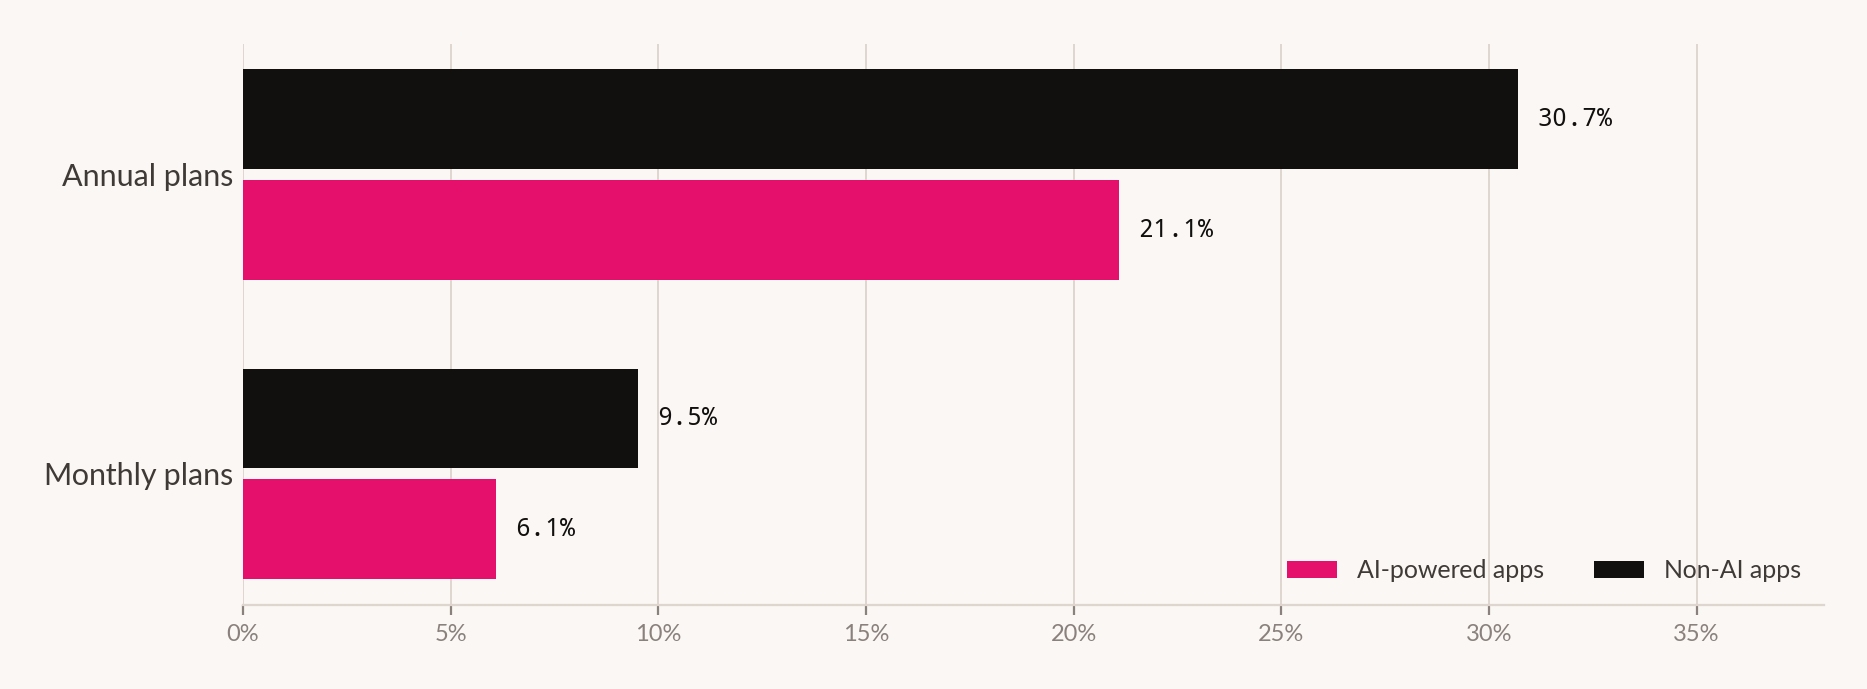
The same dataset shows AI apps on monthly plans retaining 36% worse over twelve months.1
Both figures describe the same twelve months and the same users. The category that monetises best is the category that leaks fastest.
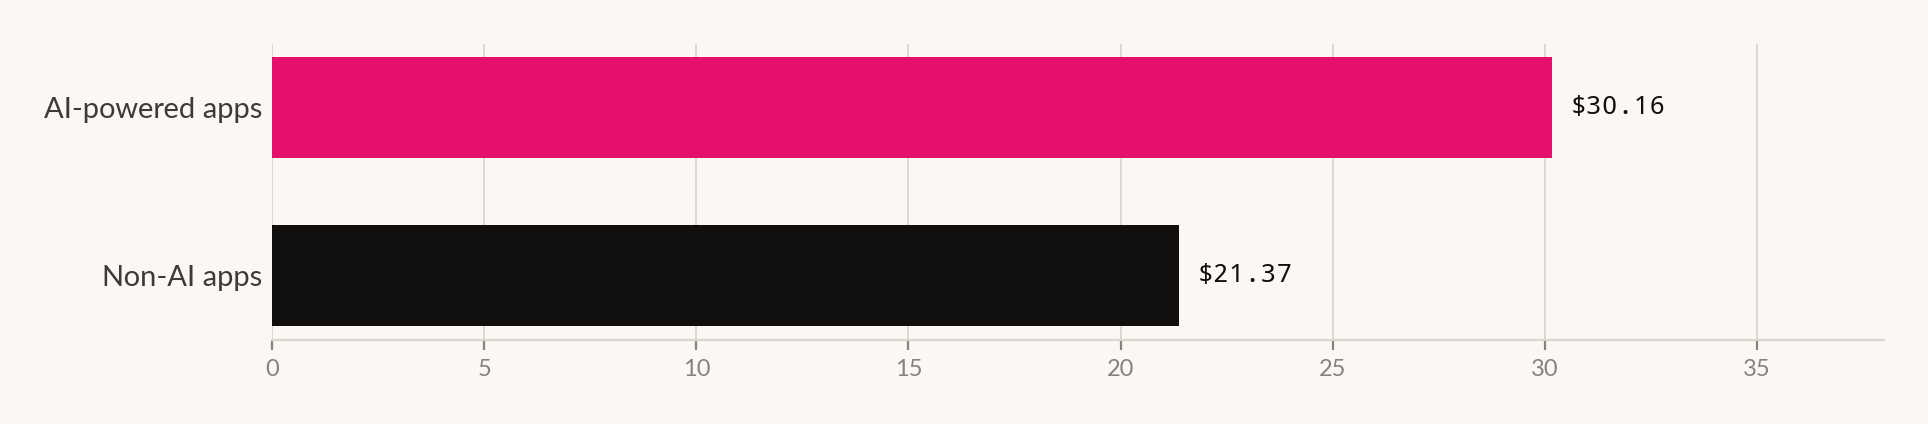
That distinction in the note carries most of the weight. A projected lifetime value would be an argument. A realised one is a receipt. AI apps collected 41% more per user in Year 1 while churning faster, which means the premium is not a promise about retention that failed - it is money that arrived anyway.
The gap did not exist a year ago
This is the part that changes the interpretation. In the 2025 edition of the same report, AI apps showed twelve-month payer retention of 9.2% on the App Store and 11.5% on Google Play - comparable to traditional apps in the equivalent categories.1
The retention gap is one year old. AI apps did not always churn faster than everything else. They started to.
RevenueCat's own reading is that the dip emerged after AI apps settled into the mainstream and users had longer to assess them.1 That is a product-market-fit argument: novelty carried the first cohorts, and once the novelty was priced in, the underlying utility was not enough.
There is a second reading, and the report does not make it.
Two explanations, one missing series
Feature 46 of this edition records that downloads of generative AI apps doubled in 2025, to 3.8 billion. A category whose install base doubles in a year is, by the following year, measuring mostly recent arrivals.
New cohorts retain worse than mature ones in every category ever measured. If AI apps' 2026 retention number is dominated by users acquired during a doubling, the number could fall without any individual cohort getting worse.
We would not claim the compositional explanation is correct. We would claim that a blended retention number for a category that doubled its user base in twelve months is a weak instrument, and that the confident product-failure narrative built on it is running ahead of what one year of data can carry.
How much of the store this now describes
AI-powered apps account for 27.1% of apps across all categories - roughly one in four.1 The distribution is extremely uneven: 61.4% of Photo and Video apps carry AI features, against 6.2% of games.1
Two things follow. First, "AI apps" is not a category, it is a feature present in a quarter of the store, and comparing it to "non-AI apps" compares a feature flag to its absence rather than one market to another. Second, an aggregate at 27.1% adoption blends a Photo and Video segment that is nearly two-thirds AI with a games segment that is almost untouched - and those two segments have entirely different retention baselines to begin with.
Alongside this, more than 14,000 new apps enter the market every month.1 Supply is expanding into a market where, as Feature 46 records, total installs grew 0.8%.
The substitution nobody prices
One structural point does not need a dataset. Most of what an AI app sells is access to a model the developer does not own, wrapped in an interface the developer does. When the underlying model becomes available more cheaply, more capably, or directly to the consumer, the wrapper's value proposition changes without the wrapper changing.
That is a different risk from ordinary competition, and it is not visible in a retention number. It shows up as a cohort that behaved normally until the month it did not.
| Measure | AI apps | Non-AI apps |
|---|---|---|
| Money | ||
| Median realised LTV per user, Year 1 | $30.16 | $21.37 |
| Premium | +41% | - |
| Retention at twelve months | ||
| Annual plans | 21.1% | 30.7% |
| Monthly plans | 6.1% | 9.5% |
| Gap, annual | −31% | - |
| Gap, monthly | −36% | - |
| A year earlier | ||
| Twelve-month payer retention, App Store, 2025 | 9.2% | Comparable |
| Twelve-month payer retention, Google Play, 2025 | 11.5% | Comparable |
| Share of the store | ||
| Apps carrying AI features, all categories | 27.1% | - |
| Photo and Video | 61.4% | - |
| Games | 6.2% | - |
| Not published | ||
| Retention by acquisition cohort, held constant | - | - |
| Year 2 realised LTV | - | - |
What to do about it
Judge an AI feature on realised Year 1 value, not retention. The premium is 41% and it is money already collected. If the decision is whether to ship AI features at all, the retention gap does not overturn a positive Year 1 return - it changes what you do in Year 2.
Get your own cohort chart before accepting the category narrative. If your install base grew sharply, your blended retention fell for arithmetic reasons. Look at monthly cohorts held constant. If mature cohorts are stable and the blend is falling, you have a growth artefact, not a product problem.
Separate monthly from annual in every conversation. The gap is 36% on monthly and 31% on annual, and those are different populations with different cancellation behaviour. A single "AI apps churn faster" number is the average of two things that should not be averaged.
Price the model dependency explicitly. If the value you sell is a model you license, write down what happens to your pricing when that model gets cheaper or goes direct. That is a scenario, not a forecast, and having it written down is worth more than the accuracy of any single version of it.
Stop treating "AI app" as a segment. It describes 27.1% of the store, ranging from 61.4% of one category to 6.2% of another. Benchmarks built on that aggregate will not describe your app.
How we did this
What this doesn't prove
- That AI features cause worse retention. The data is a correlation between an app attribute and a retention outcome across a self-selected sample. Two plausible mechanisms are set out in Figure 03 and the evidence does not distinguish them.
- That the premium persists. $30.16 is a Year 1 realised figure. If the retention gap is real and compounding, Year 2 could invert the comparison entirely. Nobody has that data.
- That these samples represent the store. RevenueCat's dataset is subscription apps using one vendor's infrastructure. It excludes advertising-monetised apps, one-time purchases, and anything not using the platform.
- How "AI-powered" was classified. The threshold for counting an app as AI-powered is not something we have seen defined, and the 27.1% share depends entirely on it.
- Anything about a specific category. A blended figure across a store where one category is 61.4% AI and another is 6.2% describes neither.
- That the 2025 comparison is like-for-like. The source states the earlier retention figures were comparable to traditional apps but does not print the matched values, so we cannot verify the size of the change, only its reported direction.
Sources for this feature
- Lorelei Whitman, The State of Subscription Apps in 10 minutes: lessons, trends, and benchmarks for 2026, RevenueCat, 19 March 2026 (updated 22 April 2026). revenuecat.com A named study, reported by someone else - named study, published by its author, vendor-conflicted
- AI-powered apps struggle with long-term retention, new report shows, TechCrunch, 10 March 2026. techcrunch.com A named study, reported by someone else
- Features 46 and 48 of this edition. Another feature in this edition