
In April 2025, the Epic Games v. Apple ruling permanently barred Apple from forcing developers onto its in-app purchase system, opening the way for web-to-app purchase flows.1 Epic Games v. Google forced Google to permit third-party app stores, grant them access to the full Play catalogue, and let developers link to alternative downloads.1
In the European Union, the Digital Markets Act had already compelled Apple to allow external purchase links and alternative marketplaces on iOS.1
This was, by any reading, the end of the walled garden. Every structural argument the industry had made for a decade was won in court.
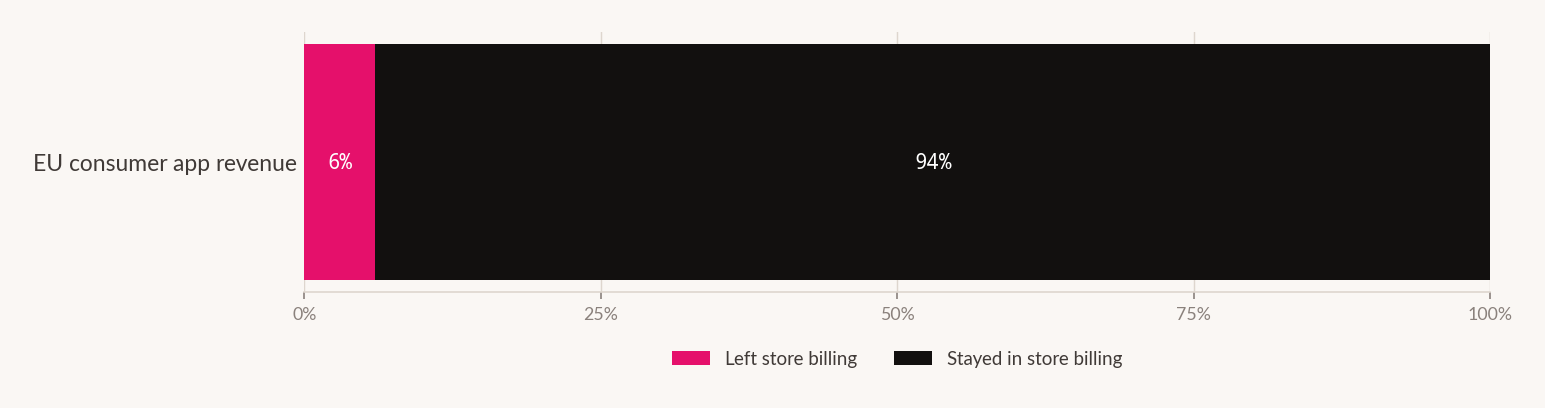
Here is what it produced. Revenue leaking out of App Store billing represents 3–6% of EU consumer app revenue in 2026.1
store billing
The maximalist regulatory case was won, in the most favourable jurisdiction, and 94–97% of the money stayed exactly where it was.
Two readings are available and they are not mutually exclusive. The first is that switching costs are real: rebuilding billing, refunds, tax handling, subscription management and trust for a web checkout is expensive, and most developers have not judged it worth doing for the commission saved. The second is that this is early. The source describes the share as growing, and a structural shift that takes a decade still counts as a shift.
What is not available is the reading the litigation implied - that the commission was the binding constraint on the app economy and removing it would visibly reorder the market. Two years on, in the friendliest possible conditions, it moved single digits.
The number that reframes the argument
Set the commission fight aside and size the thing being fought over.
App store consumer spending in 2026 is put at $190bn+. Mobile advertising revenue at $380bn+. The total mobile app economy at $600–620bn, up from an estimated $540bn in 2025.2
Which makes the app stores - the entire subject of two landmark antitrust cases, a European regulatory regime and roughly five years of industry argument - about 31% of the mobile app economy.
Advertising is roughly twice the size of the store economy. And unlike the commission - a fixed, published, litigable percentage - advertising cost is a market price that moves continuously, is set by auction, and has no regulator watching it on developers' behalf.
A developer who won the commission argument outright would improve margin on 31% of the economy. A developer who improves acquisition efficiency by a fifth is operating on the 63%.
What changed and what did not
The most useful thing on that chart is the last row, and it is a blank. Nobody has published where the saved commission went. If a developer moves a subscription to web checkout and keeps most of a 30% cut, that money either becomes margin, becomes a lower price, or becomes acquisition budget. Those are radically different outcomes for the market and there is no public evidence distinguishing them.
Where the effort actually pays
If advertising is roughly twice the store economy, the operating question for anyone running an app is not what Apple charges. It is what a user costs and what discovery is worth.
The 2025 figures give a partial view: 149bn downloads worldwide and $167bn in store consumer spending, up 10.6%.2 We would like to decompose that growth the way Feature 01 of this edition decomposes ad spend - into volume and price - but we do not have a download growth rate, so we cannot say whether spending rose because more people installed apps or because each user paid more.
That distinction is not academic. It is the difference between a market expanding its user base and a market extracting more from a stable one, and it changes what a marketing plan should optimise for. We flag it as a gap rather than guess at it.
What to do about it
Evaluate web checkout on a full cost basis, not the commission saved. The 3–6% EU leakage figure is the market's revealed answer to this calculation under the most favourable rules available. That is evidence about the true cost of switching, not about developer apathy. Model billing, tax, refunds, chargebacks, subscription management and conversion loss before assuming the 30% is yours.
Instrument where the commission saving lands. If you do move checkout, decide in advance whether the saving is margin, price or acquisition budget - and measure it. This is the number the whole industry failed to publish. You can at least have it for yourself.
Spend your attention proportionally. If roughly two-thirds of the economy runs through advertising and roughly a third through the store, the ratio of your team's effort should not be the inverse. Store commission is the loudest cost in mobile and it is not the largest one.
Treat store presence as discovery, not distribution. The rulings gave you alternative distribution and almost nobody used it, which tells you distribution was not the constraint. Being found was. That is a positioning and metadata problem, not a legal one.
Get your own volume-versus-price decomposition. We could not do it at market level for lack of a download growth rate. You can do it for your own app in an afternoon, and it will tell you whether your revenue growth is coming from more users or more per user - which determines almost everything else.
| Measure | Value | Grade |
|---|---|---|
| Store economy | ||
| Consumer spending, iOS + Google Play, 2025 | $167bn | Reported |
| Year-over-year growth | +10.6% | Reported |
| Worldwide downloads, 2025 | 149bn | Reported |
| Apple share of two-store spending | 70.5% | Reported |
| Google Play share | 29.5% | Reported |
| Total mobile app economy | ||
| Consumer spending, 2025 | ~$540bn | Estimate |
| Projected, end 2026 | $600–620bn | Projection |
| App store consumer spending, 2026 | $190bn+ | Projection |
| Mobile advertising revenue, 2026 | $380bn+ | Projection |
| Store share of total economy | ~31% | Our arithmetic |
| Advertising share of total economy | ~63% | Our arithmetic |
| Regulatory outcome | ||
| Revenue leaked from App Store billing, EU 2026 | 3–6% | Single source |
| Where saved commission went | - | Not published |
| Download growth rate 2024→2025 | - | Not obtained |
How we did this
What this doesn't prove
- That the litigation was pointless. Establishing a right and exercising it are different things, and rights compound over decades. The argument here is about measured economic effect to date, not about whether the cases should have been brought.
- That leakage will stay at 3–6%. The source explicitly describes it as growing. A single-digit share in year two is not a ceiling.
- The reliability of the market totals. The $540bn and $600–620bn figures are commercial estimates whose methodology we have not seen, and their components do not reconcile with the stated total.
- That advertising and store revenue are cleanly separable. Much mobile advertising sells goods that are then transacted in-store, and some store revenue is driven entirely by ad spend. Treating them as two pools is a simplification.
- Why store spending grew 10.6%. Without a download growth rate we cannot separate more users from more revenue per user. This is the single most useful missing number in the feature.
- Anything about individual app categories. Gaming, subscription and commerce apps have entirely different exposure to both commission and acquisition cost. Market averages describe none of them.
- Anything outside the US and EU. The regulatory outcomes discussed are jurisdiction-specific, and app economics in India and China - covered in Features 06, 07 and 08 of this edition - operate under different structures again.
Sources for this feature
- App market trends 2026: The year ahead according to experts, Business of Apps. businessofapps.com A named study, reported by someone else - trade, expert-sourced
- Mobile app market sizing for 2025–2026, commercial research summaries. fwctecnologia.com, sqmagazine.co.uk From a company that sells into this market - vendor summary
- Features 01, 06, 07 and 08 of this edition. Another feature in this edition