
The top quartile of subscription apps grew monthly recurring revenue by 80% or more in the year to 2026. The bottom quartile lost more than 33%. The gap between them is 113 points.1
The report that publishes those figures - 115,000 apps, more than $16 billion in revenue - describes what sits between them as a middle ground that is evaporating.1
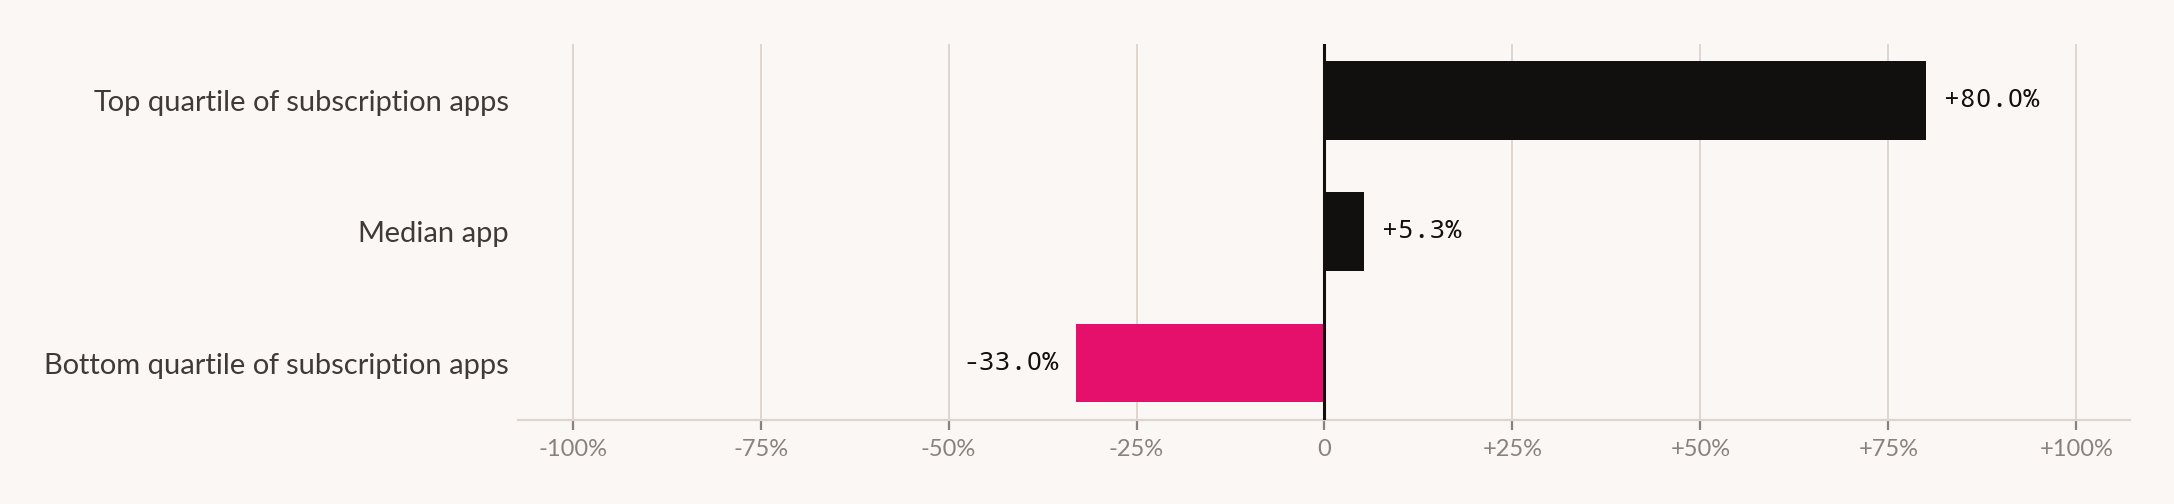
Alongside the growth spread sits a revenue spread that has been widening for two years: the top 5% of apps earn 400 times what the bottom quartile earns, up from 200 times in 2024.1
And into that market, more than 14,000 new apps arrive every month.1 Feature 46 of this edition records that total installs across both stores grew 0.8% over the same period.
Supply expanding at 14,000 products a month, demand for installs expanding at under one per cent a year, and a revenue distribution stretching from 200-to-1 to 400-to-1 in twenty-four months.
The industry is moving away from its own evidence
The most interesting number in the report is not about winners. It is about a decision the whole market is getting wrong in the same direction, on purpose.
Free trials of 17 to 32 days convert to paid at a median of 42.5%. Trials of under four days convert at 25.5% - meaning the long trial converts roughly 70% better.1
Over the same period, the share of apps using trials of under four days rose from 42.1% to 46.5%.1
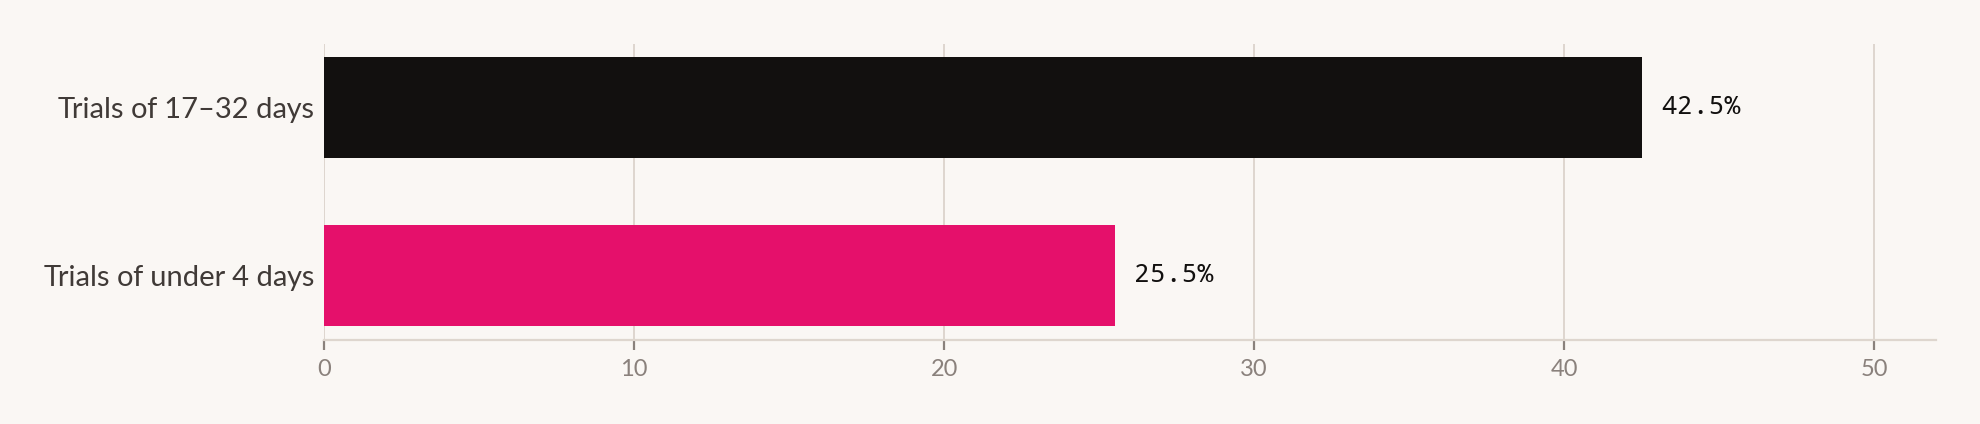
The report's own explanation, quoted from its authors, is that developers run three-day trials for cash flow - money in three days rather than thirty - and to get conversion data back fast enough to keep running onboarding and paywall experiments.1
That is not ignorance. It is a working-capital decision that costs conversion, made by teams who need the cash sooner than they need the higher rate. Which is exactly what you would expect from a market where the bottom quartile is shrinking 33% a year.
A three-day trial is a one-session trial
55.4% of all cancellations on three-day trials happen on day zero. By the end of day one, 84% of them have happened. A year earlier the day-zero figure was around 51%.1
So the modal user subscribes to get past the paywall, evaluates the product in a single session, and turns off auto-renew before closing the app. The trial length is nominal. The real evaluation window is the first session, and it is getting shorter.
This reframes the paywall argument that sits next to it in the same report. Apps with hard paywalls show a median day-35 trial-to-paid conversion of 10.7% against 2.1% for freemium, and generate $3.09 revenue per install at day 60 against $0.38.1
But retention a year later is 27% for hard-paywall apps and 28% for freemium - a difference the report itself calls negligible.1 And hard-paywall conversion fell from 12.1% the year before, while freemium held flat at 2.1%.
What that combination actually says
Hard paywalls pull revenue forward. They do not appear to produce better subscribers - the twelve-month retention difference is one point. And the mechanism is weakening: the hard-paywall conversion rate fell roughly two points in a year while the freemium rate did not move. A lever that collects money sooner is a different thing from a lever that builds a better business, and only one of those is being measured here.
Annual subscriptions stopped meaning a year
72% of annual subscribers cancelled auto-renewal during Year 1, up from around 56% the previous year. 35% of all annual cancellations occur in Month 1. Cancellations then fall to 3–10% a month through the middle of the year before spiking again ahead of renewal.1
The user is not buying twelve months of a relationship. They are buying one year of a product and closing the loop immediately so it does not recur. The developer's Year 2 revenue is decided in Week 1, and in most cases decided against them.
A third of Android churn is a billing bug
31% of subscription cancellations on Google Play are involuntary billing failures - expired cards, declines, retries that did not recover. On the App Store the figure is 14%.1
Both moved: Google Play worsened from 28.2% the previous year, the App Store improved from 15.1%.1
Nearly a third of Android churn, then, is not a product judgement. It is a payment that failed and was not recovered. That is the cheapest revenue in this entire feature, and it is recovered by dunning logic and grace periods rather than by acquiring anyone.
| Measure | 2026 | 2025 | Direction |
|---|---|---|---|
| Distribution | |||
| Top quartile MRR growth, threshold | +80% | - | New this year |
| Bottom quartile MRR growth, threshold | −33% | - | New this year |
| Top 5% revenue against bottom 25% | 400× | 200× (2024) | Widening |
| New apps entering per month | 14,000+ | - | - |
| Trials | |||
| Conversion, trials of 17–32 days | 42.5% | - | - |
| Conversion, trials under 4 days | 25.5% | - | - |
| Share of apps using trials under 4 days | 46.5% | 42.1% | Rising |
| 3-day trial cancellations on day zero | 55.4% | ~51% | Rising |
| Paywalls | |||
| Day-35 conversion, hard paywall | 10.7% | 12.1% | Falling |
| Day-35 conversion, freemium | 2.1% | 2.1% | Flat |
| Revenue per install at day 60, hard paywall | $3.09 | - | - |
| Revenue per install at day 60, freemium | $0.38 | - | - |
| Yearly subscribers retained at 12 months, hard paywall | 27% | - | - |
| Yearly subscribers retained at 12 months, freemium | 28% | - | - |
| Annual plans and billing | |||
| Annual subscribers cancelling in Year 1 | ~72% | ~56% | Worsening |
| Share of annual cancellations in Month 1 | 35% | - | - |
| Google Play cancellations from billing failure | 31% | 28.2% | Worsening |
| App Store cancellations from billing failure | 14% | 15.1% | Improving |
What to do about it
Fix billing recovery before you fix anything else. If you have a meaningful Android base, roughly a third of your churn is involuntary. Retry logic and grace periods recover revenue from users who never decided to leave, at no acquisition cost.
Know why your trial is three days. If the answer is cash flow or experiment velocity, that is a defensible trade and you should write down what it costs you in conversion. If the answer is that everyone does it, the data says everyone is wrong by roughly 70%.
Design the first session, not the trial. With 55% of three-day trial cancellations landing on day zero, the trial length is a billing setting and the first session is the actual product decision.
Treat Week 1 of an annual subscription as the renewal campaign. Month 1 accounts for 35% of annual cancellations. The Year 2 conversation happens in Week 1 whether you participate in it or not.
Do not read the paywall comparison as causal. Hard paywalls collect earlier. The one-point retention difference at twelve months says they do not obviously collect from better people. Pull revenue forward if you need it forward - but book it as a cash-flow decision, not a quality one.
How we did this
What this doesn't prove
- That long trials cause higher conversion. The comparison is observational. Confident teams with mature onboarding may both choose longer trials and convert better for reasons unrelated to duration.
- That the market is consolidating. A widening revenue ratio and a hollowing middle in one year of one dataset is a pattern, not a structural conclusion. Quartile thresholds also move with sample composition, and this sample grows every year.
- Anything about non-subscription apps. Advertising-monetised apps, one-time purchases and games with in-app currencies are outside this dataset entirely, and they are a large majority of the store.
- That the Google Play billing gap is Google's fault. 31% against 14% is a large difference, but card mix, regional payment infrastructure and user demographics differ between the platforms in ways this figure does not separate.
- Why annual cancellation worsened from 56% to 72%. A sixteen-point move in one year is very large for a behavioural metric, and the source offers no mechanism. Sample composition change is at least as plausible as a change in user behaviour.
- That any of these benchmarks describe your app. Medians across 115,000 apps spanning every category and price point are orientation, not targets.
Sources for this feature
- Lorelei Whitman, The State of Subscription Apps in 10 minutes: lessons, trends, and benchmarks for 2026, RevenueCat, 19 March 2026 (updated 22 April 2026). revenuecat.com A named study, reported by someone else - named study, published by its author, vendor-conflicted
- State of Subscription Apps 2026, RevenueCat report landing page. revenuecat.com A named study, reported by someone else - primary study
- Features 46 and 47 of this edition. Another feature in this edition