
For fifteen years the argument for digital video was that it was not television. It was addressable, it was measurable, it was clickable, and the person watching was one action away from a purchase. Budgets moved on that promise.
The Q1 2026 delivery data says the promise has quietly expired - not because the platforms changed their pitch, but because viewers changed the screen.
TV screens accounted for 72% of YouTube video campaign spend in the quarter. Across streaming services generally, TV screens took 67% of video ad spend.1 Most digital video money is now delivering to a device with no cursor, no keyboard and nobody sitting close enough to tap it.
The most striking number in the set is smaller and stranger. Shorts - YouTube's vertical, mobile-native, TikTok-response format - became the second-largest video format at 18% of campaign spend. And 58% of Shorts ad spend delivered on TV screens.
Vertical short-form video, designed for a phone held in one hand, is now mostly being watched on a television.
The screen shift, measured
video campaigns
(all services)
The structural marker sits alongside this. US CTV ad spend is projected at $42.4bn in 2026, and CTV upfront commitments of $17.73bn are forecast to exceed primetime linear upfronts of $16.98bn for the first time.2
Upfronts are a useful signal precisely because they are slow. They represent budget committed in advance, by large advertisers, through a process designed around television buying conventions. When the upfront crosses over, it is not early adopters moving - it is the centre of the market having already moved and the paperwork catching up.
Why YouTube's CPM fell 21%, and what it was not
YouTube delivered 20% spend growth in Q1 on 52% impression growth, with CPM down 21%. Google Demand Gen showed the same pattern harder: 22% spend growth, 59% impression growth, CPM down 23%.
The obvious explanation is a supply flood. Amazon switched Prime Video to ad-supported by default in early 2024, adding more than 115 million US ad-supported viewers effectively overnight, and Prime Video's own CPM slid from roughly $35.25 to around $28.01 by the end of that year.3 Reported supply-expansion effects pushed CPMs down 10–15% on non-tentpole inventory. Amazon Prime Video ad spend then grew 71% year over year in Q1 2026.
So: enormous new supply, falling prices, case closed.
Except the data does not support it cleanly. If a market-wide CTV supply glut were driving prices down, it should show up across CTV inventory generally. It does not.
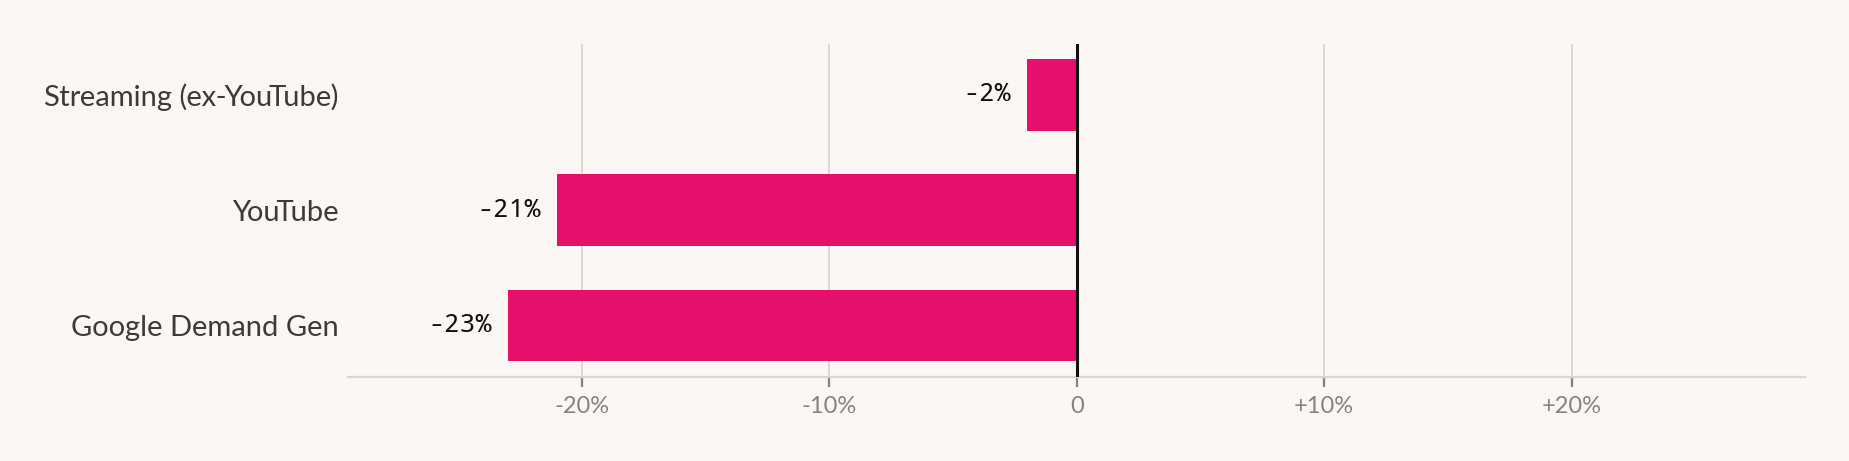
Streaming video outside YouTube saw CPM fall 2%. Essentially flat. Meanwhile the two Google video channels fell twenty points further.
A market-wide supply glut cannot produce a 21-point decline on one seller's inventory and a 2-point decline on everyone else's. The more parsimonious explanation is mix, and Feature 01 of this edition described the mechanism: when a cheaper format grows its share of the blend, the blended average falls without any individual price changing.
Shorts reached 18% of YouTube campaign spend. Shorts inventory is cheaper per thousand impressions than in-stream pre-roll. Impressions grew 52% against 20% spend growth - a lot more units, at a materially lower average price, exactly as a mix shift toward a cheap format would produce.
The Prime Video supply effect is real and documented, but the timing places most of it in 2024, and its measured impact was concentrated in non-tentpole streaming inventory, where the Q1 2026 movement is around 2%. It has largely been absorbed.
Why this distinction is worth the paragraph
Because the two explanations imply opposite actions. If CTV prices are falling market-wide, the correct response is to buy more CTV while it is cheap. If YouTube's blended CPM is falling because Shorts is diluting the average, then buying "more YouTube video" at the blended rate means buying more Shorts - and you should establish whether Shorts converts for you before you scale into it.
A blended CPM decline is not an instruction. It is a question about mix.
The measurement problem nobody has solved
Here is the consequence that matters more than the pricing.
The performance-video operating model assumes a click. Impression, click, landing page, conversion, attribution. Every optimisation loop, every automated bidding strategy trained on conversion signal, every dashboard built in the last decade assumes the viewer can act on the ad inside the same device.
A television cannot click. Delivery to a TV screen produces a view and nothing else. The subsequent action - if it happens - occurs later, on a different device, unattributed, and in most measurement configurations invisible.
When 72% of YouTube video spend and 67% of streaming spend deliver to that screen, the majority of digital video budget is now flowing into inventory that the standard performance measurement stack cannot see through.
This produces three failures, each visible in accounts today.
1. Attribution understates CTV systematically
Last-click and click-based multi-touch models cannot attribute a TV-screen view. The conversion, when it arrives, is credited to whatever clickable thing came last - usually branded search or direct. CTV therefore appears to underperform in exactly the reports advertisers use to decide budget, while search appears to overperform by absorbing credit for demand it did not create.
This is not a new problem; it is the old television measurement problem, reappearing inside tools that were built on the assumption it had been solved.
2. Frequency is uncontrolled across sellers
The same household can be reached by YouTube on the TV, Prime Video on the same TV, and two or three other streaming services, all within an evening. Each seller manages frequency within its own inventory. Nobody manages it across the set.
With CTV at $42.4bn and growing, and no cross-platform frequency standard in general use, the probability that a meaningful share of impressions is being served to households already saturated is high - and unmeasured, which means it is not currently anybody's line item.
3. The optimisation loop trains on the wrong signal
Automated bidding optimises toward the conversion signal it receives. If TV-screen impressions rarely produce attributable conversions, an automated system will learn to move budget away from TV-screen inventory - regardless of whether that inventory is driving incremental sales.
The machine is not wrong. It is doing exactly what it was told, using the only evidence it has. The evidence is incomplete in a specific, structural, knowable direction.
| Channel | Spend | Impressions | CPM | Note |
|---|---|---|---|---|
| Google video | ||||
| YouTube | +20% | +52% | −21% | 72% of spend on TV screens |
| YouTube Shorts | 18% of YouTube campaign spend | 58% of Shorts spend on TV | ||
| Google Demand Gen | +22% | +59% | −23% | Video 65% of Demand Gen spend |
| Google Display Network | +10% | −22% | +41% | Moving opposite to video |
| Streaming | ||||
| Streaming video (ex-YouTube) | +6% | +8% | −2% | 67% of spend on TV screens |
| Amazon Prime Video | +71% | - | - | Ad tier default since early 2024 |
| Market | ||||
| US CTV ad spend, 2026 | $42.4bn forecast | Upfronts ≈ level with linear | ||
What to do about it
Stop reading CTV performance from click-based reports. If your video reporting is built on attributed conversions, it is systematically understating TV-screen inventory and systematically overstating whatever clickable placement sits downstream of it. That is not a calibration issue to be corrected with a multiplier; it is a structural blind spot requiring a different instrument.
Use the instrument television always used. Geo-based incrementality testing, holdout designs and media mix modelling exist precisely because TV was never clickable. They are not exotic. They are the appropriate tools for the medium digital video has become, and they are considerably cheaper now than when television last needed them.
Separate Shorts from in-stream in reporting. Two formats with different costs, different attention profiles and different conversion behaviour are currently averaged into one YouTube line. At 18% of spend and rising, Shorts is large enough that the blend is now actively misleading - and it is the most likely explanation for your falling CPM.
Ask your sellers what frequency they are managing, and across what. Most will answer honestly that they manage it within their own inventory. That answer is the finding. Cross-platform frequency is currently an unowned problem sitting inside a $42bn channel.
Do not let automated bidding decide CTV allocation unsupervised. Where the conversion signal is structurally incomplete for a channel, an optimiser trained on that signal will defund the channel. That may be correct. It may also be the most expensive measurement artefact in the account. The only way to distinguish them is a test the optimiser cannot run for you.
How we did this
What this doesn't prove
- That CTV underperforms or overperforms. Nothing here measures conversion or incremental return on TV-screen inventory. The argument is that the standard reporting stack cannot see it, which is a different claim from either direction of performance.
- That Shorts is cheaper than in-stream. This is the load-bearing assumption in the mix explanation and we do not have format-level CPM to confirm it. It is stated as an assumption in the Method block for exactly this reason.
- That the Prime Video supply expansion did not affect Q1 2026 pricing. It plausibly contributed. Our argument is that it cannot be the primary driver of a 21-point YouTube decline when broader streaming moved 2 points, not that its effect is zero.
- Anything about attention or outcome quality on TV screens. A larger screen is not evidence of greater impact. We make no claim about relative effectiveness by device.
- Anything outside the US. All market figures are US. CTV penetration, upfront conventions and streaming market structure differ substantially elsewhere.
- The scale of the frequency problem. We argue it is unmanaged across sellers, which follows from how frequency capping works. We have no measurement of how much duplication actually occurs, and we are not aware of a public dataset that does.
Sources for this feature
- Tinuiti, Digital Ads Benchmark Report, Q1 2026. tinuiti.com Straight from the source
- US CTV ad spend and upfront commitment forecasts, 2026, via industry coverage. emarketer.com A named study, reported by someone else - forecast
- Prime Video ad tier launch, ad-supported reach and CPM movement, 2024–2026, via industry coverage. A named study, reported by someone else
- Karooya, Digital Ads Benchmark Report by Tinuiti, Q1 2026: Key Highlights. karooya.com Secondary