
Social advertising is usually discussed as one market. In Q1 2026 it behaved as two, and they moved in opposite directions.
On the large feed platforms, unit costs fell. Meta CPM down 3%. Facebook down 4%. Instagram down 3% - its first CPM decline since 2023. Pinterest down 8%.1
On Reddit, spend rose 77% and CPM rose 71%.1
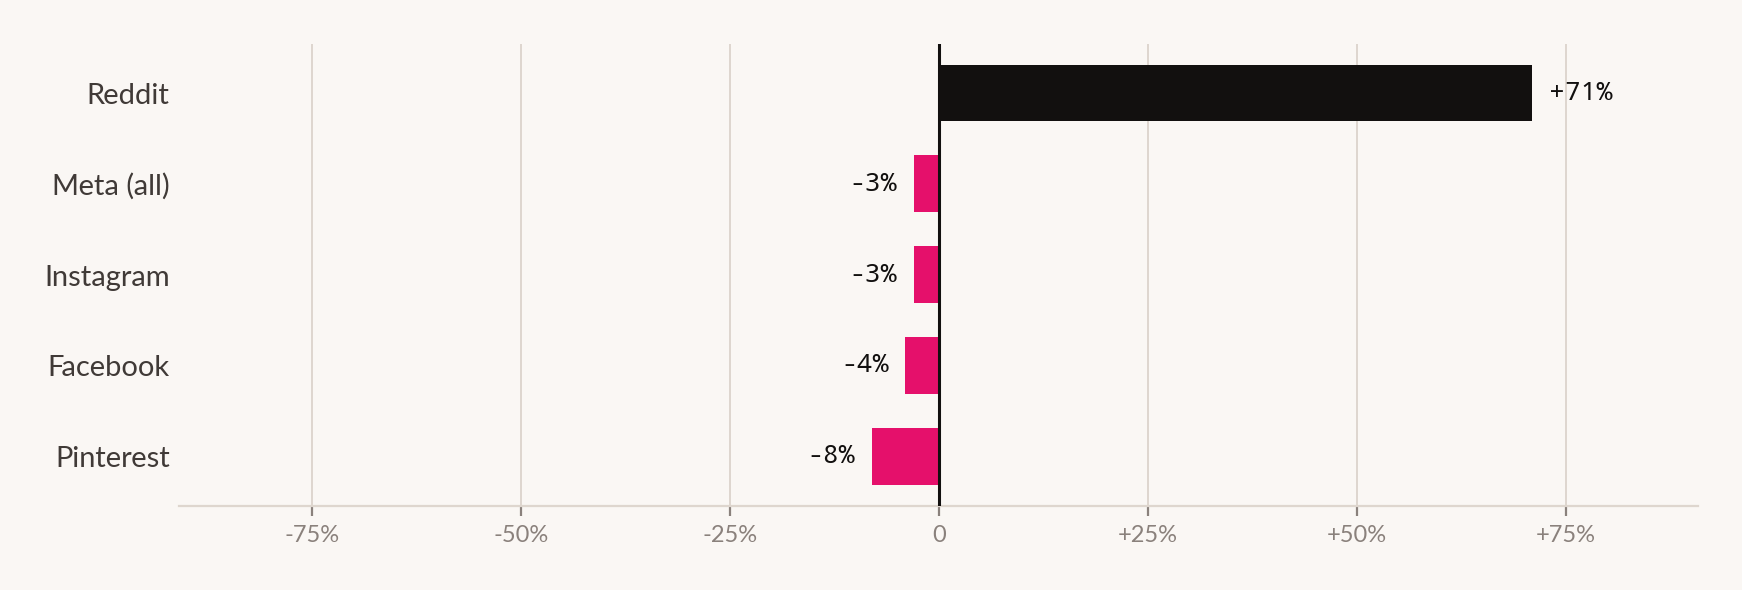
Impressions on the largest social platforms are getting cheaper. Impressions inside communities are getting dramatically more expensive. Both are demand signals, pointing in the same direction.
A falling CPM on a growing platform means supply is arriving faster than demand for it. A CPM rising 71% means the opposite: more advertisers competing for inventory that is not expanding proportionally. Reddit's growth was almost entirely repricing, not scaling.
Inside Meta: a seven-fold growth gap
The most striking divergence in the quarter happened inside a single company.
Instagram grew ad spend 28% on 31% impression growth. Facebook grew 4% on 8%.1 Same parent, same ad system, same buying interface, same quarter - and a seven-fold gap in growth rate.
Note what the blended Meta number does here. Meta as a whole reported 13% spend growth - a perfectly respectable figure that describes neither of its two main properties. An advertiser reporting "Meta performance" at the account level is averaging a platform growing at 28% with one growing at 4%.
And inside Instagram, one format is eating another
Instagram's own composition shifted sharply. Reels reached 33% of Instagram ad impressions, up from 19% a year earlier - the highest share ever recorded in this sample. Feed, the dominant placement as recently as Q4 2023, fell to 26%.1
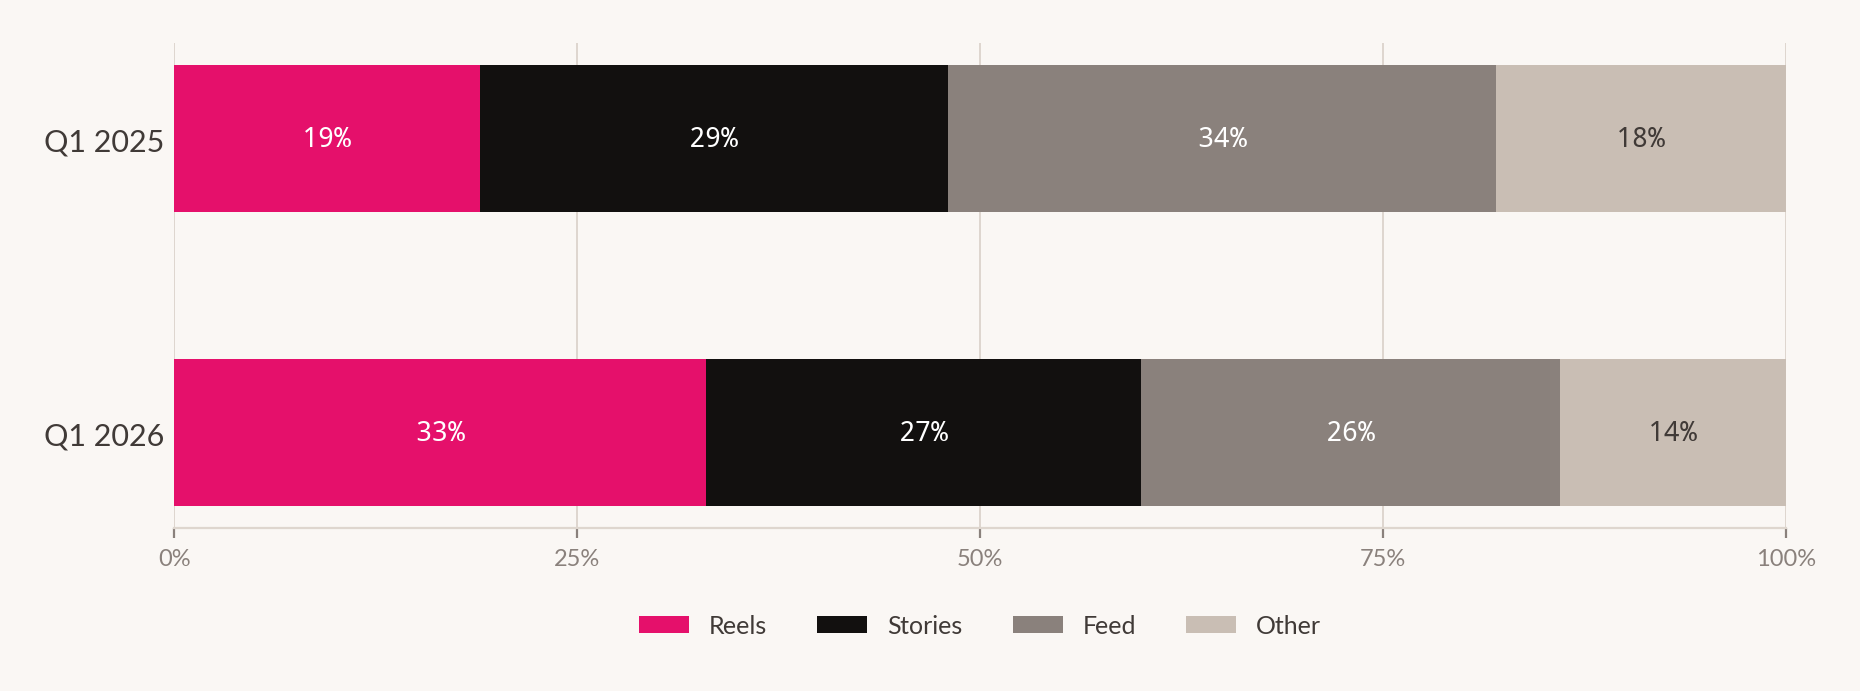
This is the most probable explanation for Instagram's CPM decline, and it matters because it is not an efficiency gain. As Feature 01 of this edition set out: when a cheaper format grows its share of the blend, the blended average falls without any individual price changing. Instagram did not get cheaper to advertise on. It sold a different, cheaper thing.
Where attention got expensive
The Reddit number is the one worth planning around, because it is a price signal about something that is not for sale in unlimited quantity.
Reddit is organised by interest community rather than social graph. Its inventory does not scale the way a feed does - you cannot manufacture more r/specific-niche by increasing ad load without visibly degrading the thing advertisers came for. When demand rises against inventory like that, price does the adjusting.
A 71% CPM increase in twelve months is the market pricing context. And the broader shift is consistent: platforms including Reddit, Substack and Discord are powering private groups and micro-communities, in a movement explicitly away from mass reach.2
The operating consequence is uncomfortable for anyone whose social plan was built on last year's costs. If a community channel worked at last year's CPM and CPMs are up 71%, last year's result is not a forecast. It is a record of a market that has changed.
The trust layer is moving too
The same pattern appears in the creator economy, measured differently.
56% of weekly podcast listeners say podcast hosts are the type of influencer that matters most to them - nearly triple the share who say the same about social media influencers.2
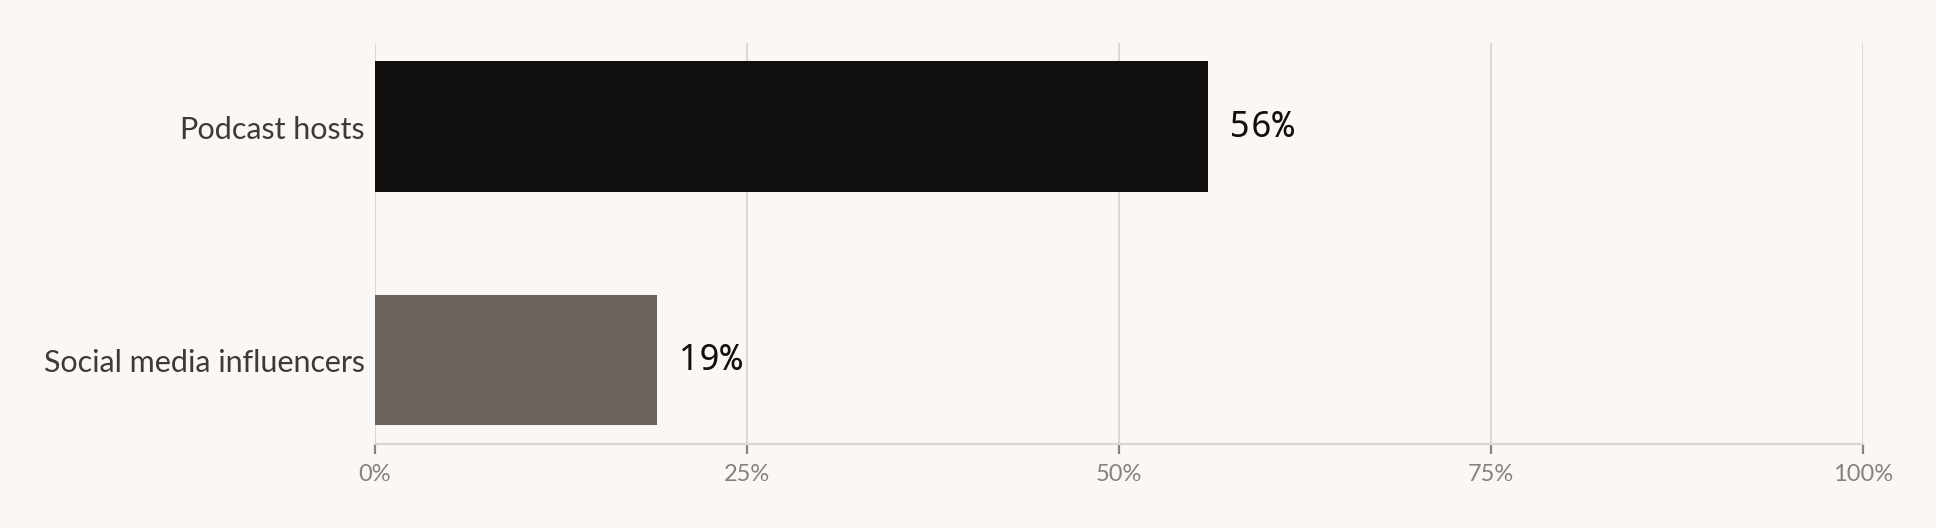
Take the sample bias seriously: asking podcast listeners which influencers they trust will favour podcast hosts. But even discounted, the ratio is large, and it is directionally consistent with the other creator-economy signal.
Micro and nano influencers will claim 45.5% of influencer marketing spending in 2026.2 Nearly half of influencer budget going to the smallest creators is a substantial reallocation away from reach and toward relationship.
Podcast hosts and nano-influencers have almost nothing in common as media formats. What they share is that the audience believes there is a person on the other side - which is precisely the property that a feed algorithm optimising for engagement cannot manufacture, and precisely what advertisers are now paying a premium to access.
The creator economy, sized
The scale underneath this is not marginal. The creator economy is forecast to grow from $255.66bn in 2025 to $323.48bn in 2026, a compound growth rate of 26.5%. Social media creator revenue specifically rises 16.2% to $20.6bn.2,3
The revenue mix tells you who holds the power. In 2026 creators earn 59% of revenue from sponsored content, 24.4% from platform payouts and 8.2% from affiliate marketing.2
Nearly three-fifths of creator income comes directly from brands. That makes the creator layer a media buy in economic terms, not a platform phenomenon - and it means the pricing dynamics that apply to community inventory apply here too. Demand for a fixed supply of credible voices moves price, and there is no version of that supply expanding at the rate budgets are.
What this adds up to
Assemble the quarter and a single structure appears.
Broadcast social - the large feeds - is deflating in unit cost while inflating in volume. Meta grew impressions 17% while CPM fell 3%. Instagram grew impressions 31% while CPM fell 3%. Pinterest grew impressions 37% while CPM fell 8%. There is more inventory than there is competition for it, and the mix is shifting toward cheaper formats.
Community and creator social is doing the opposite. Reddit's CPM up 71%. Nearly half of influencer budget moving to the smallest creators. Trust concentrating in podcast hosts by a factor of roughly three over social influencers.
Reach has never been cheaper. Being believed has never been more expensive.
For most advertisers that is not a choice between the two. It is a reason to stop treating them as one line.
| Platform / measure | Spend | Impressions | CPM |
|---|---|---|---|
| Broadcast social | |||
| Meta (all properties) | +13% | +17% | −3% |
| +28% | +31% | −3% | |
| +4% | +8% | −4% | |
| +27% | +37% | −8% | |
| Community social | |||
| +77% | - | +71% | |
| Format shift | |||
| Instagram Reels, impression share | 33% (from 19% a year earlier) | ||
| Instagram Feed, impression share | 26% (was the leading placement in Q4 2023) | ||
| Meta Advantage+ share of retail spend | 20% (from a 38% peak - see Feature 02) | ||
| Creator economy | |||
| Creator economy size, 2026 | $323.48bn (from $255.66bn, 26.5% CAGR) | ||
| Social media creator revenue, 2026 | $20.6bn (+16.2%) | ||
| Micro and nano share of influencer spend | 45.5% | ||
| Podcast hosts named most-trusted influencer type | 56% (among weekly podcast listeners) | ||
What to do about it
Split Instagram and Facebook in reporting immediately. A 28% and a 4% growth line averaged into "Meta" produces a number that describes neither and hides the only interesting thing in the account. This costs one afternoon.
Split Reels and Feed as well. Reels is now the largest Instagram placement and cheaper per thousand. If your Instagram CPM fell this year, this is almost certainly why - and the question that follows is whether Reels converts for you, which the blended number will never answer.
Re-baseline every community channel. Reddit, and by extension the community platforms behaving like it, repriced by 71% in a year. Any plan carrying last year's CPM assumptions on those channels contains an error you can quantify today.
Treat creator spend as media buying, not partnership. With 59% of creator income coming from brands and nearly half of influencer budget flowing to nano and micro tiers, this is a market with supply constraints and price discovery. It should be planned, negotiated and measured like inventory, because that is what it is.
Buy cheap reach deliberately, not accidentally. Falling CPMs on the large feeds are a genuine opportunity for advertisers who need volume and can measure whether it converts. The failure mode is drifting into cheap inventory because the blended cost looks better, without establishing whether cost per outcome moved with it.
How we did this
What this doesn't prove
- Anything about conversion. Every platform figure here is a media-buying metric. Cheaper Meta impressions and expensive Reddit impressions say nothing about which produces more incremental revenue.
- That Reddit's premium is justified. A 71% CPM increase tells you demand rose against constrained supply. It does not tell you the inventory is worth the new price, and no public data addresses that.
- Why Facebook is growing at a seventh of Instagram's rate. Audience age, format mix, advertiser preference and inventory availability are all plausible. The data does not decompose it.
- That Reels is cheaper than Feed. This is the load-bearing assumption behind the mix explanation and we have no placement-level CPM data to confirm it - the same limitation flagged in Feature 04.
- That podcast hosts are more effective than social influencers. The finding measures stated trust among a biased sample, not campaign outcomes.
- Anything outside the US. All figures are US-weighted. Platform mix, creator economics and community platform penetration differ substantially elsewhere - including in India, where Feature 06 of this edition found AI-driven discovery behaving differently again.
Sources for this feature
- Tinuiti, Digital Ads Benchmark Report, Q1 2026. tinuiti.com Straight from the source
- EMARKETER creator economy forecasts and analysis, 2026. emarketer.com A named study, reported by someone else
- Creator Economy Market Report 2026, commercial research summary. From a company that sells into this market - vendor research
- Features 01, 02 and 04 of this edition. Another feature in this edition