
Feature 14 of this edition ended with a table containing three deliberately blank rows. One of them read "Download growth rate 2024→2025 - not obtained", and the accompanying note said the missing figure was the single most useful number absent from the analysis, because without it there was no way to tell whether app store spending grew from more users or more money per user.
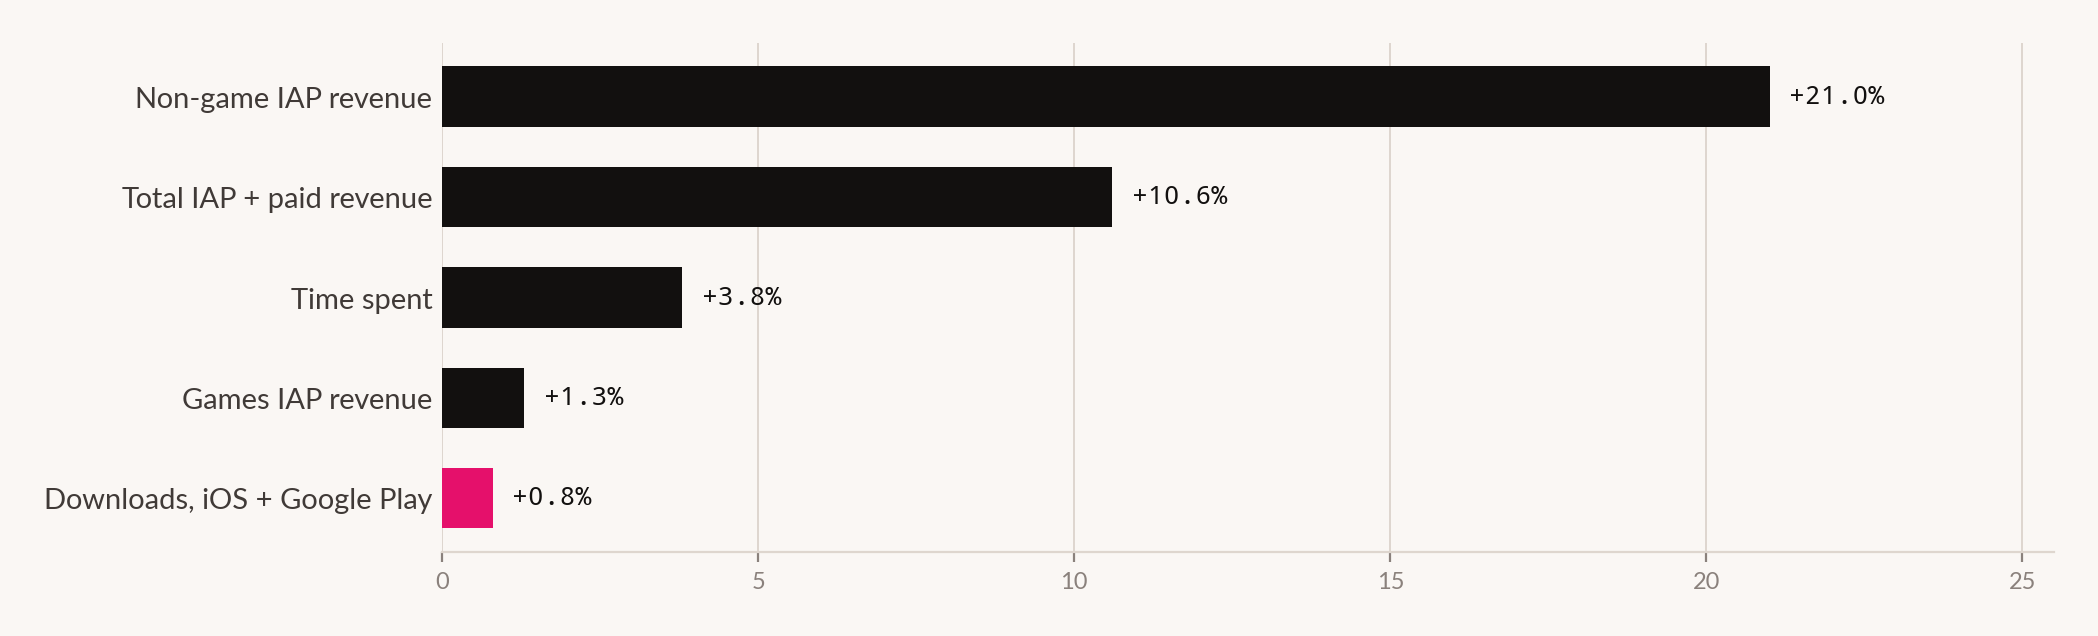
The number has since been published. Downloads across iOS and Google Play rose 0.8% in 2025, to nearly 150 billion. Store revenue over the same period rose 10.6%, to $167 billion.1
That is the decomposition. It is not close.
What a thirteen-to-one ratio means
Revenue grew roughly thirteen times faster than installs. Run the arithmetic the other way and revenue per download rose about 9.7% while the number of downloads was essentially unchanged.
Nothing about 2025 was an acquisition story. Almost the entire increase came from people who had already installed something.
This has a consequence that most app growth plans are not written for. If total installs are flat, the install market is a fixed pool. An app that grows its install base in a flat market is not expanding the category - it is taking share. Every install won is an install another product lost.
User acquisition in a growing market and user acquisition in a flat one are different activities with different economics. In the first, spending more brings in genuinely new demand. In the second, spending more bids against competitors for a supply that does not respond to price. Feature 01 of this edition documents what happens to ad prices when demand rises against fixed supply, and the mechanism here is the same one.
Time spent did rise - 5.3 trillion hours across both stores, up 3.8%, or roughly 3.6 hours per day per mobile user.1 So engagement grew faster than installs and slower than revenue. Existing users are spending somewhat more time and considerably more money.
The crossover nobody announced
Underneath the aggregate is a structural change. In 2025, in-app purchase revenue from non-game apps exceeded revenue from games for the first time.1
Games IAP revenue approached $82 billion, up 1.3% - a third consecutive year of growth, and a recovery from the correction that followed the 2021 peak. Non-game IAP revenue grew 21%, reaching nearly three times what it was five years earlier.1
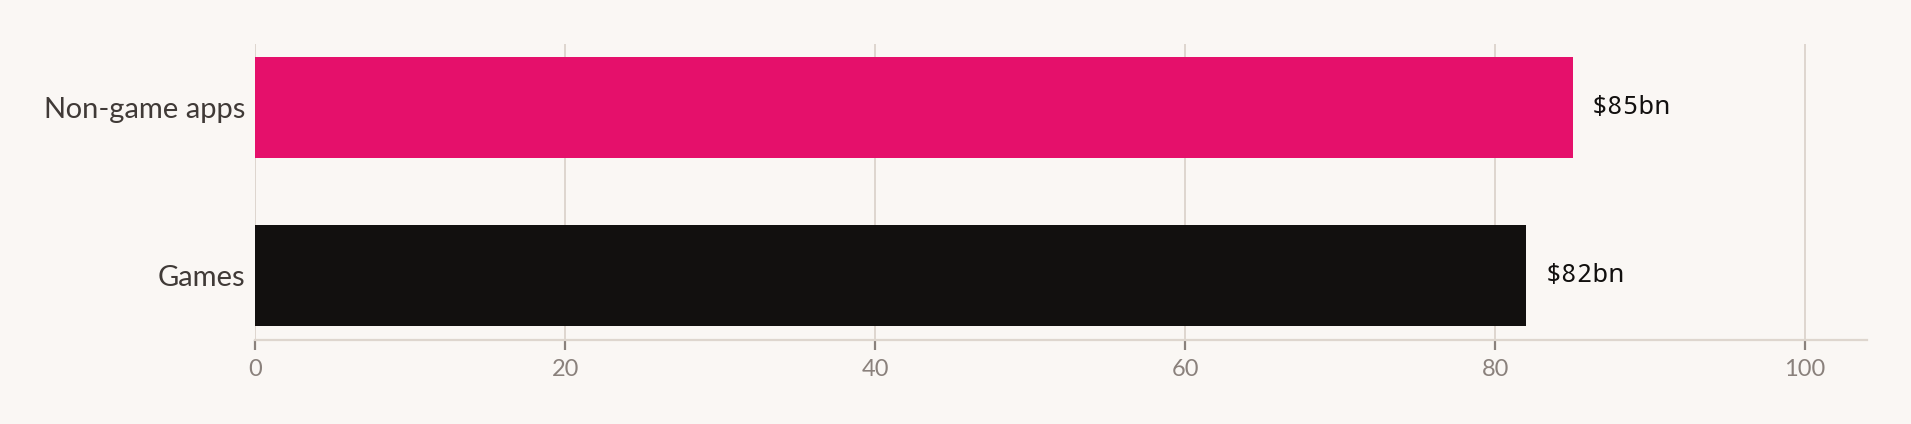
Eighteen years into app stores, the thing they were mainly for stopped being the thing they mainly earn from. Games did not shrink. They stopped compounding, and something else did not.
Sensor Tower's own framing of the games position is worth quoting for its precision: with installs down and time spent up, growth depends less on adding users and more on expanding lifetime value from the existing base.1 That is a description of a mature category. It now also describes the whole market.
Where the 0.8% came from
A flat aggregate can hide a great deal of movement underneath it, and in 2025 it did.
Downloads of generative AI apps doubled year over year to reach 3.8 billion. In-app purchase revenue from those apps nearly tripled to exceed $5 billion. Time spent in them reached 48 billion hours, roughly 3.6 times the 2024 total and close to ten times the 2023 level, and sessions passed one trillion.1
Now put the download figure against the market. A 0.8% increase on a base of roughly 150 billion is a net gain of about 1.2 billion downloads. Generative AI apps, doubling from roughly 1.9 billion to 3.8 billion, added about 1.9 billion on their own.
One category appears to have supplied more than the whole market's net download growth, which would mean everything else, taken together, slipped.
We would not push that further than the arithmetic supports. Two rounded figures divided into each other produce a fragile result, and a small error in either the base or the market total flips the sign of the residual. But the direction is not fragile: the growth in installs was concentrated in one category, and that category is nine years younger than the app stores it arrived in.
Feature 47 of this edition examines what happens to those users afterwards.
Where the money is
The United States remained the largest market by revenue, with consumers spending nearly $60 billion in 2025 - roughly 36% of the global total by our arithmetic. US time spent rose 4%, a modest rebound after signs of fatigue in 2024. Western European growth was led by the United Kingdom, Germany and France.1
| Measure | Value | Grade |
|---|---|---|
| Reported | ||
| Downloads, iOS + Google Play | ~150bn | Vendor panel |
| Download growth | +0.8% | Vendor panel |
| IAP and paid revenue | $167bn | Vendor panel |
| Revenue growth | +10.6% | Vendor panel |
| Time spent | 5.3tn hrs | Vendor panel |
| Time spent growth | +3.8% | Vendor panel |
| Games IAP revenue | ~$82bn | Vendor panel |
| Games revenue growth | +1.3% | Vendor panel |
| Non-game revenue growth | +21% | Vendor panel |
| US consumer spending | ~$60bn | Vendor panel |
| Our arithmetic | ||
| Non-game IAP revenue | ~$85bn | $167bn less $82bn |
| Revenue per download, change | ~+9.7% | 1.106 ÷ 1.008 |
| Ratio, revenue growth to download growth | ~13× | 10.6 ÷ 0.8 |
| US share of global store revenue | ~36% | $60bn ÷ $167bn |
| Still not obtained | ||
| Payer count, or change in payer count | - | Not published |
| Split of revenue growth: more payers vs higher spend per payer | - | Not published |
What follows from a flat install market
Stop reporting installs as a growth metric. In a market where total installs moved 0.8%, an install number tells you about share and nothing about expansion. Revenue per install, payback period and cohort value are the series that carry information now.
Price your acquisition against a fixed pool. If category installs are flat, competitor bidding is the dominant force in your acquisition cost, not category growth. That changes the payback assumption underneath every campaign plan.
Look at the crossover before you assume your category's ceiling. Non-game revenue grew 21% and tripled over five years. Whatever ceiling a category was assumed to have, the aggregate says the constraint is monetisation design rather than audience size.
Do your own volume-versus-price split every quarter. It takes an afternoon, and it determines whether your growth plan should be about reach or about depth. At market level the answer for 2025 is unambiguous, and it is depth.
Read the games number as a preview, not a laggard. Games hit flat installs first and responded by shifting to lifetime-value expansion. The rest of the market arrived at the same position in 2025. The playbook already exists in the category everyone stopped paying attention to.
How we did this
What this doesn't prove
- That downloads are a good proxy for users. They count installs, including reinstalls and installs across multiple devices by one person. A flat download count is not proof of a flat user base.
- That the market is saturated. Flat installs in 2025 is one year. Downloads had also just surpassed the previous high set in 2023, which is not the shape of a category in decline.
- Whether more people paid or the same people paid more. This is the decomposition below the one we performed, and it needs a payer count nobody publishes.
- Anything about acquisition cost. We assert that a flat pool changes bidding dynamics. We have not shown cost-per-install data here, and the vendor cost figures available to us disagree with each other by margins wide enough to make citing them irresponsible.
- That the crossover is durable. Non-game passed games by roughly $3bn on our subtraction, inside the error bars of a panel estimate. The five-year trend is the durable claim; the crossing point in a specific year is not.
- Anything about revenue outside the two stores. Web checkout, alternative marketplaces and direct billing sit outside this measurement entirely. Features 14 and 49 of this edition address that gap.
Sources for this feature
- Jonathan Briskman, 2026 State of Mobile: AI Moves Mobile into Its Next Phase, Sensor Tower, January 2026. sensortower.com From a company that sells into this market - vendor research, named author, panel-derived
- Features 01, 14 and 49 of this edition. Another feature in this edition